
Data Analyst
Fig for Data Analysts
Your autonomous action engine for business intelligence and strategic execution.
Try Fig nowSee what data analyst teams do with Fig
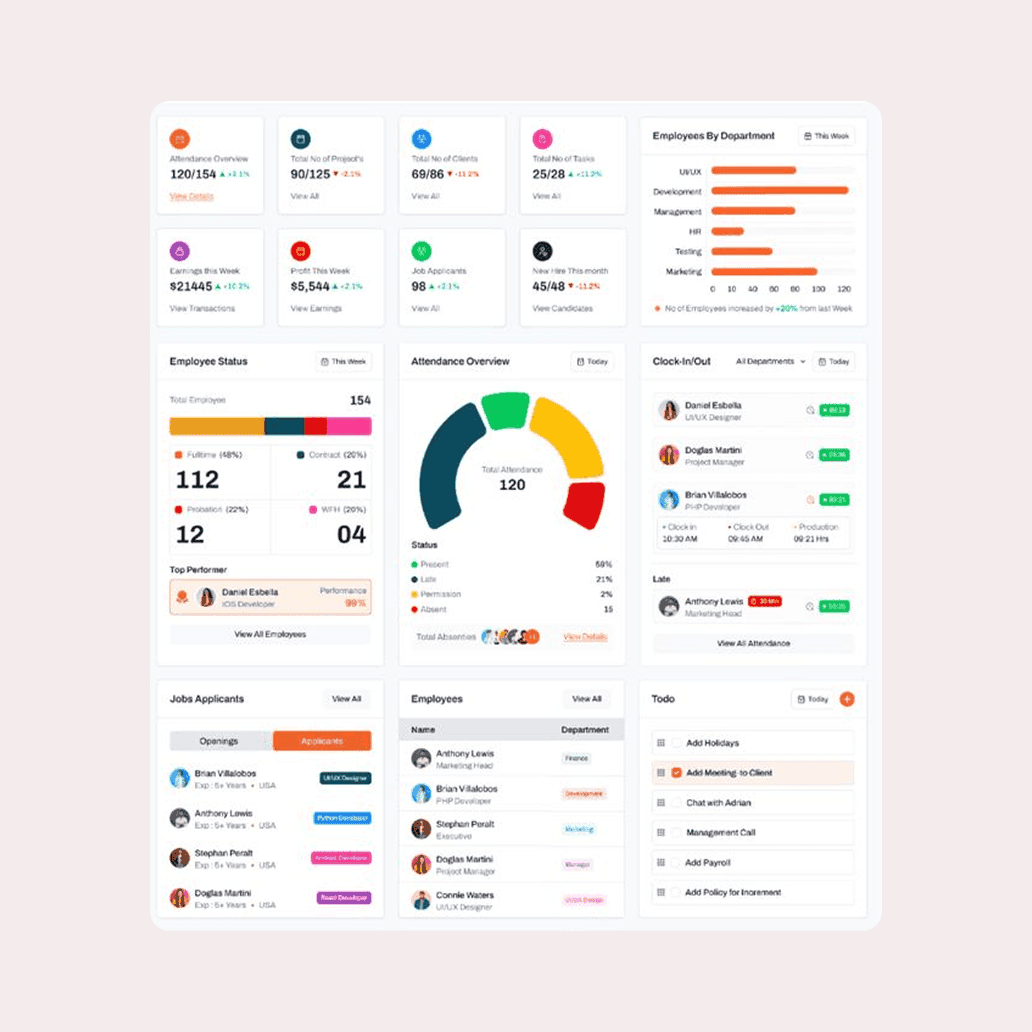
Integrated Modeling. Draft multi-variable financial models instantly. Receive a fully operational, multi-scenario spreadsheet built for complex forecasting from a single request.
Only Fig Can Do
Master sophisticated, end-to-end analytical workflows that standard tools can't handle. Move from raw data to a finalized deliverable with one single prompt
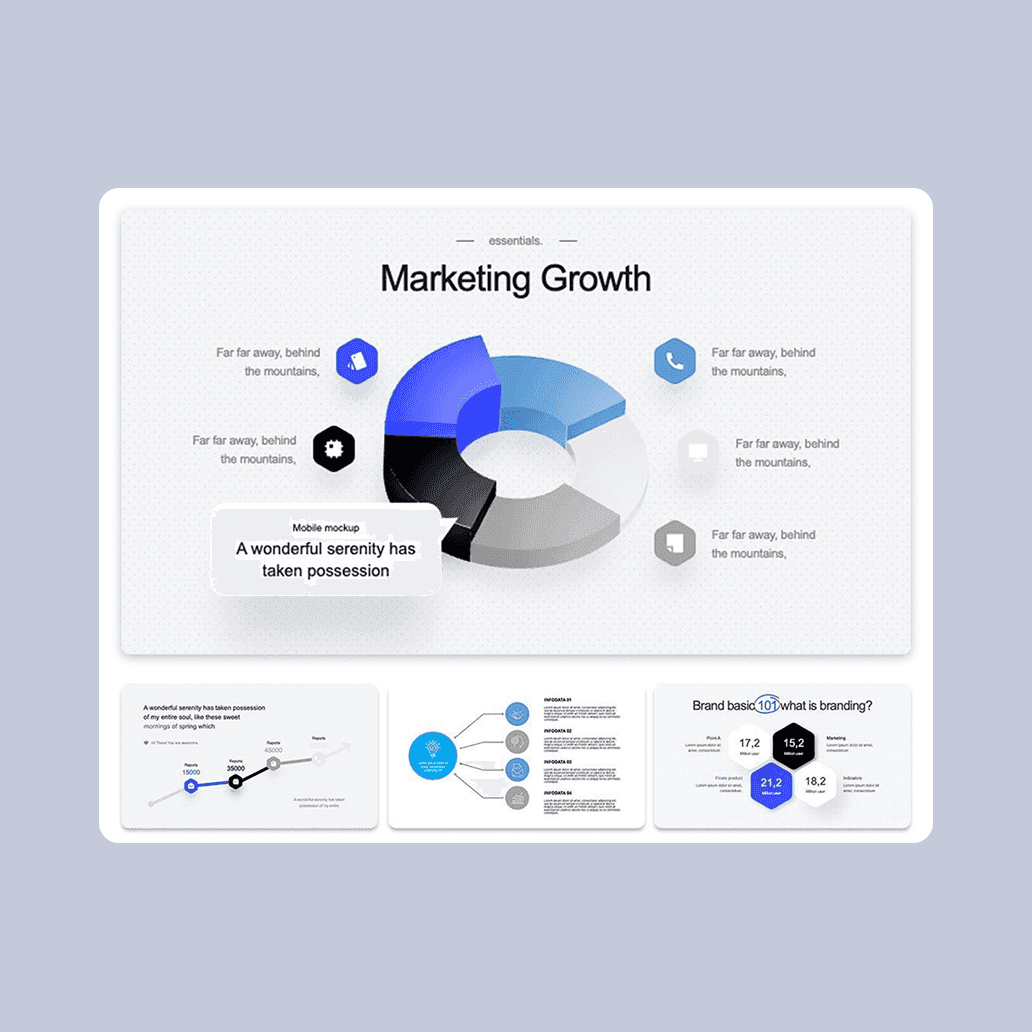
Develop data-backed growth frameworks
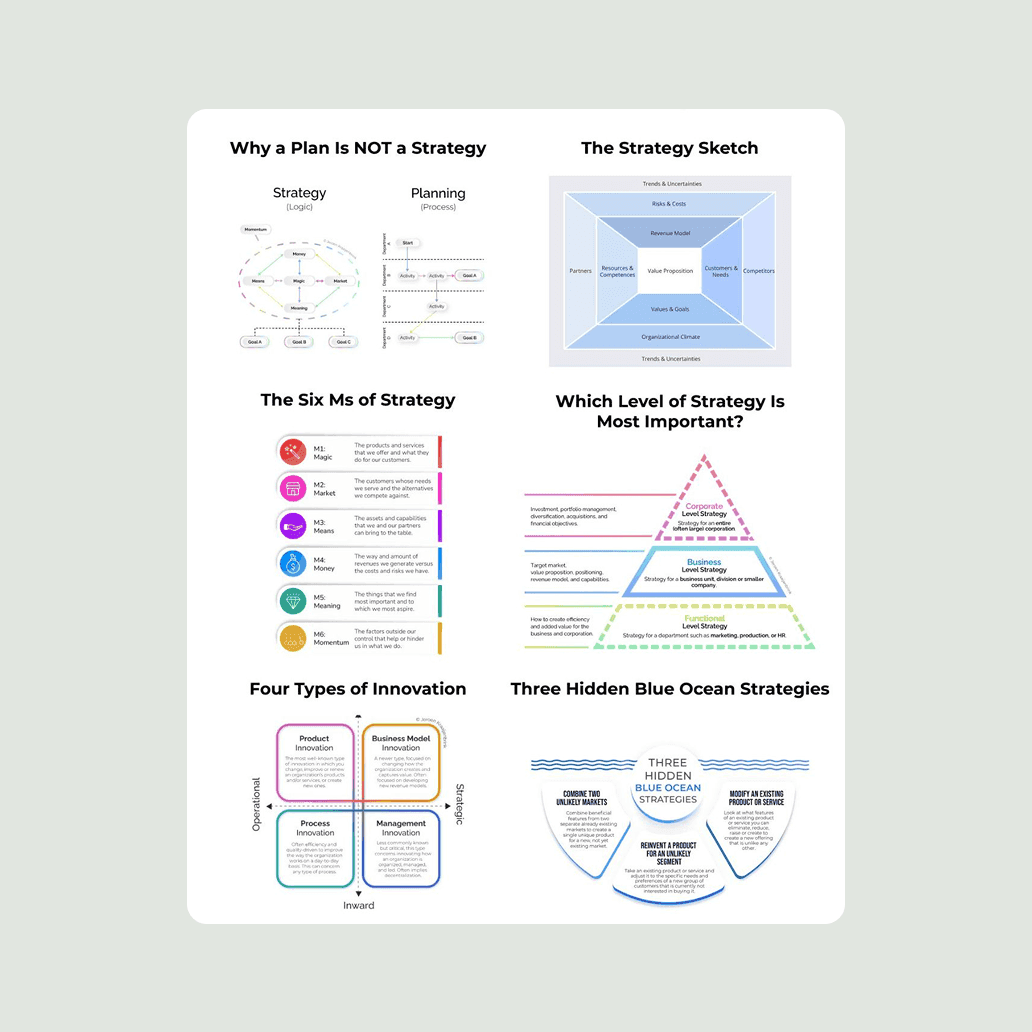
Move from raw market signals to comprehensive strategic plans. Fig researches, synthesizes, and delivers client-ready presentations in record time.
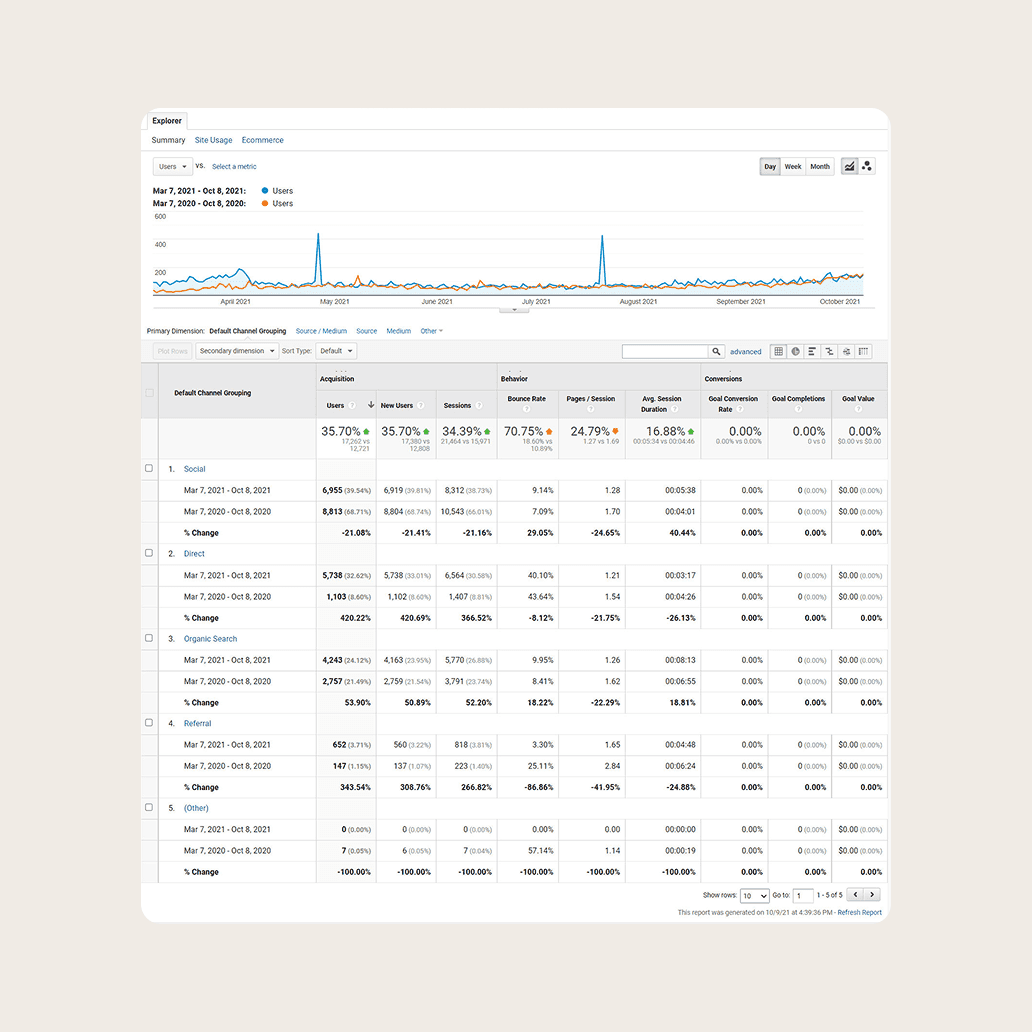
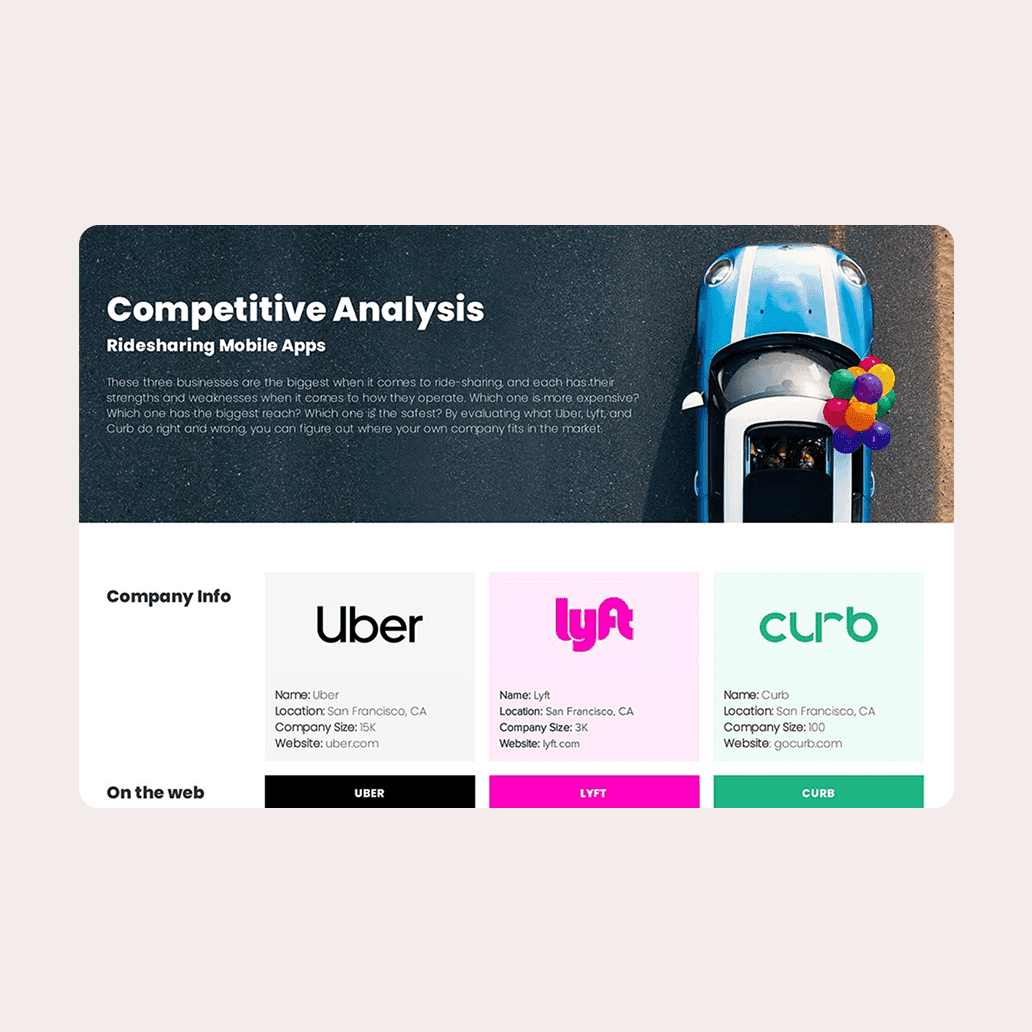
Standardize benchmarking across every channel
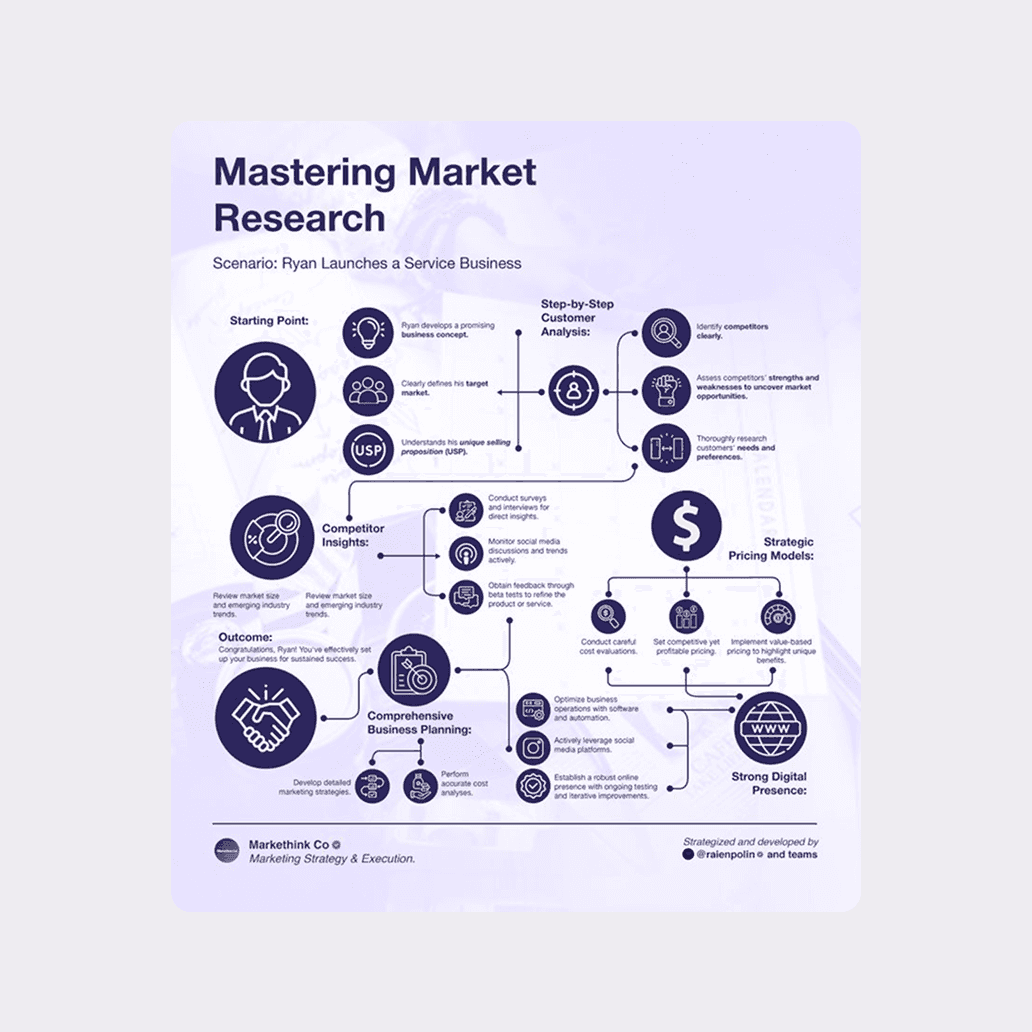
Automate competitive tracking across social platforms, ad spend, and product launches to extract actionable insights with zero lag.
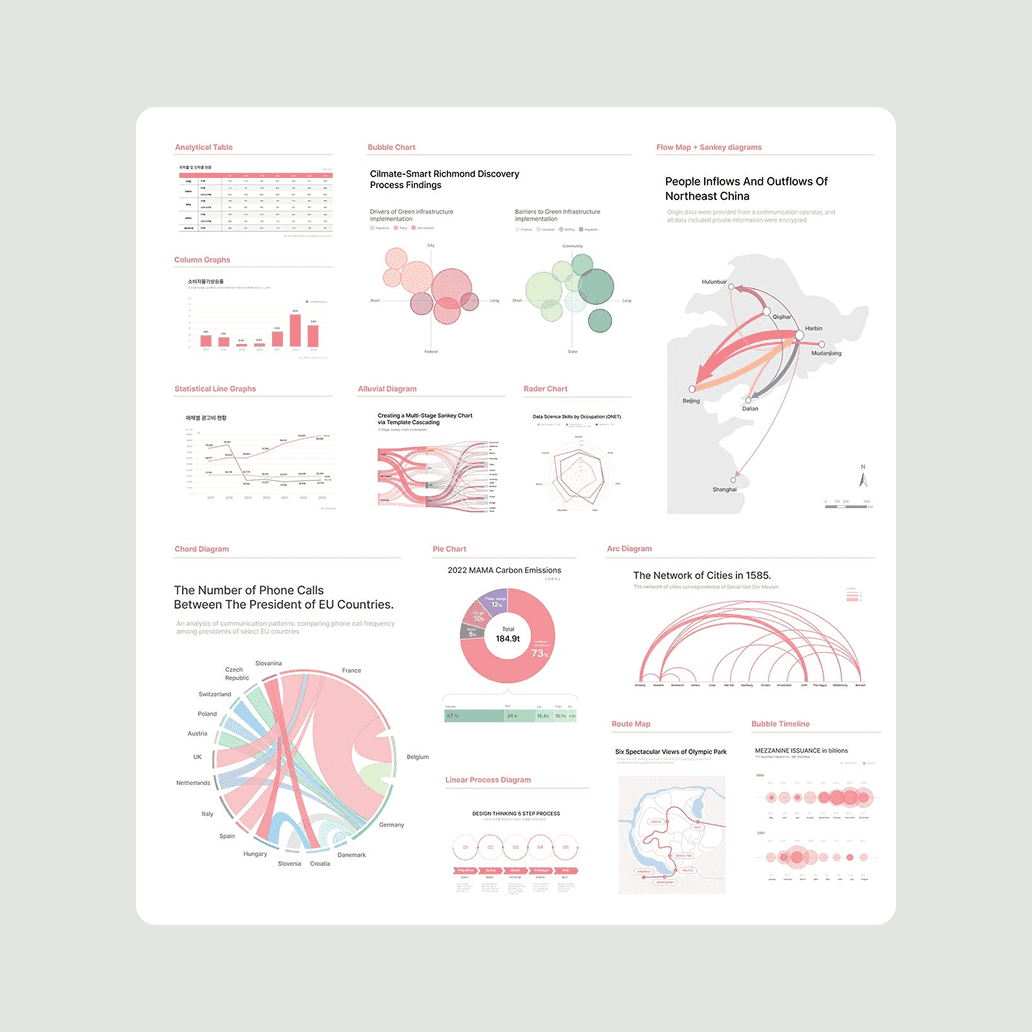
Transform static datasets into dynamic dashboards
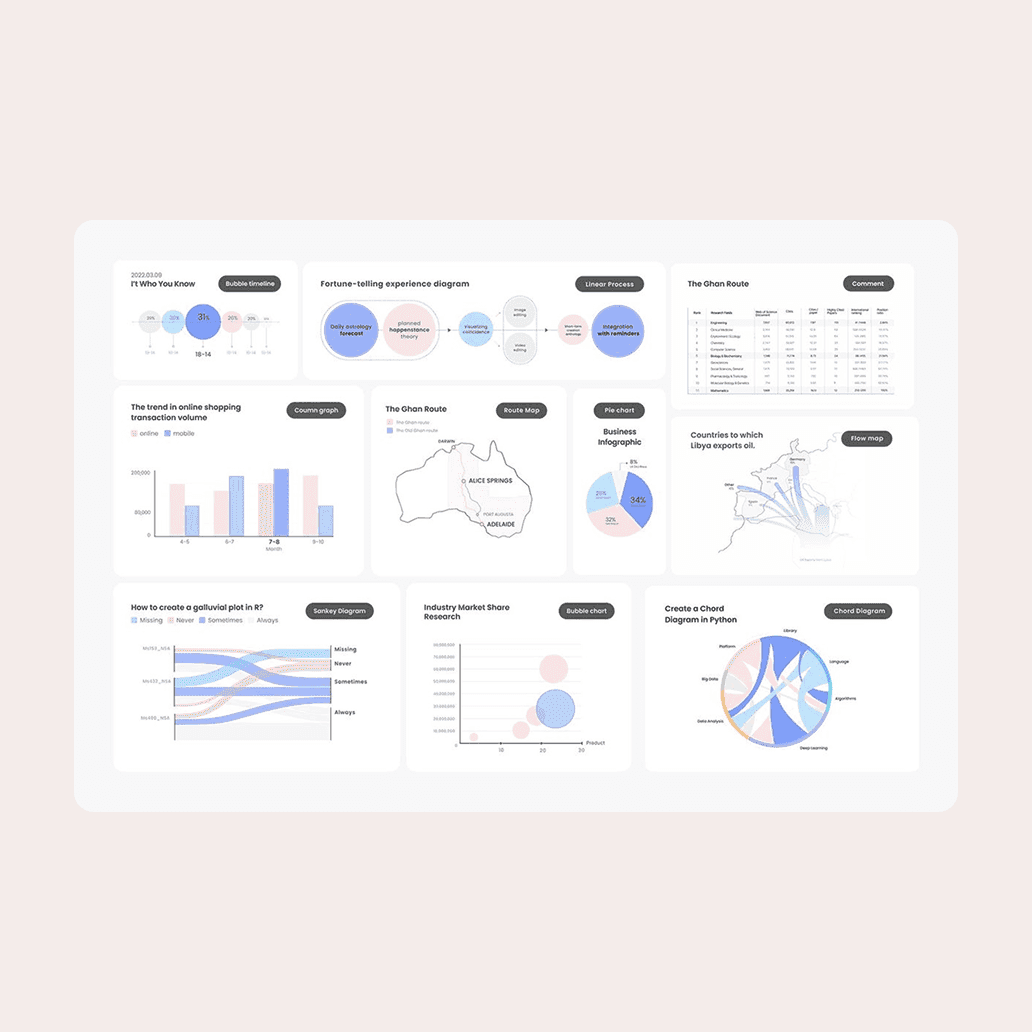
Turn raw data into a live, interactive environment. Visualize emerging trends, filter specific segments, and share findings with stakeholders instantly.
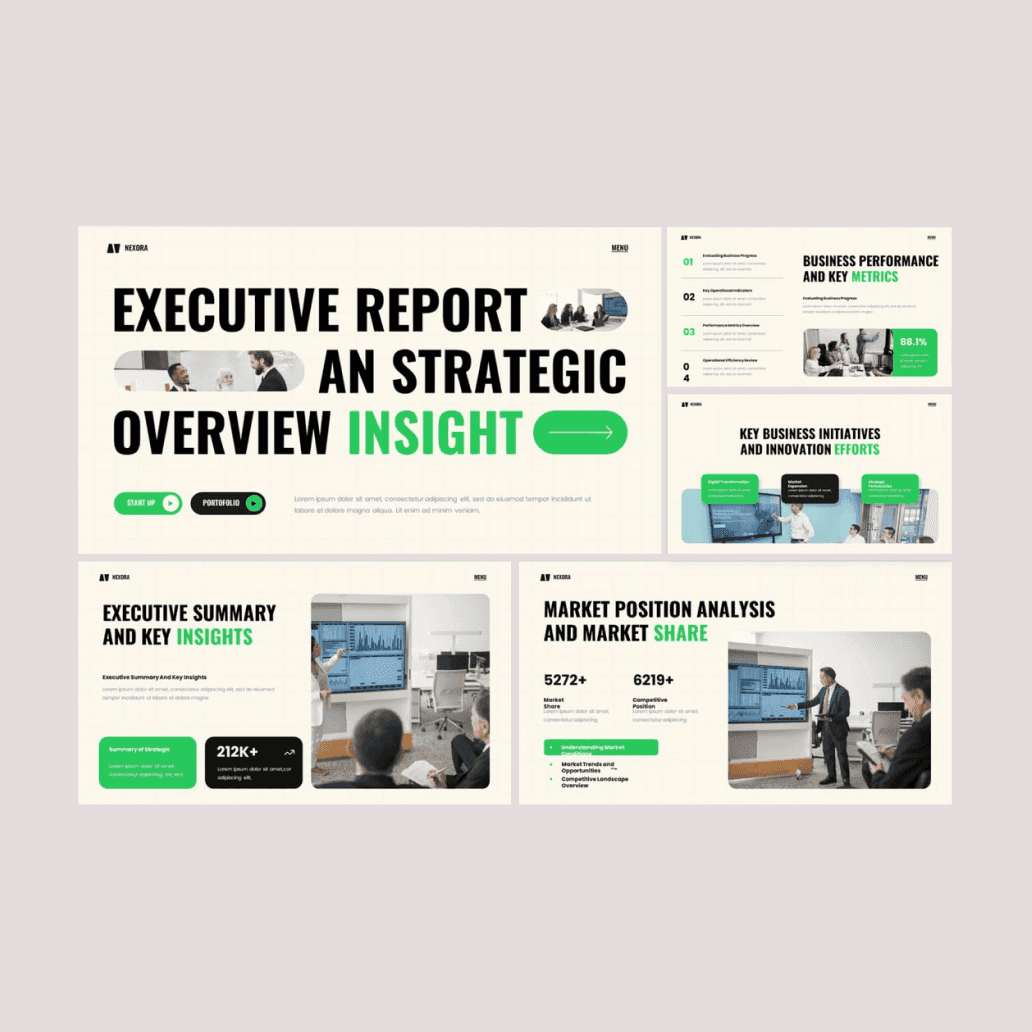
Identify and qualify deal targets at speed
Accelerate top-of-funnel deal sourcing. Automate the identification of target firms, enrich their profiles, and generate outreach-ready lists in one cohesive sweep.
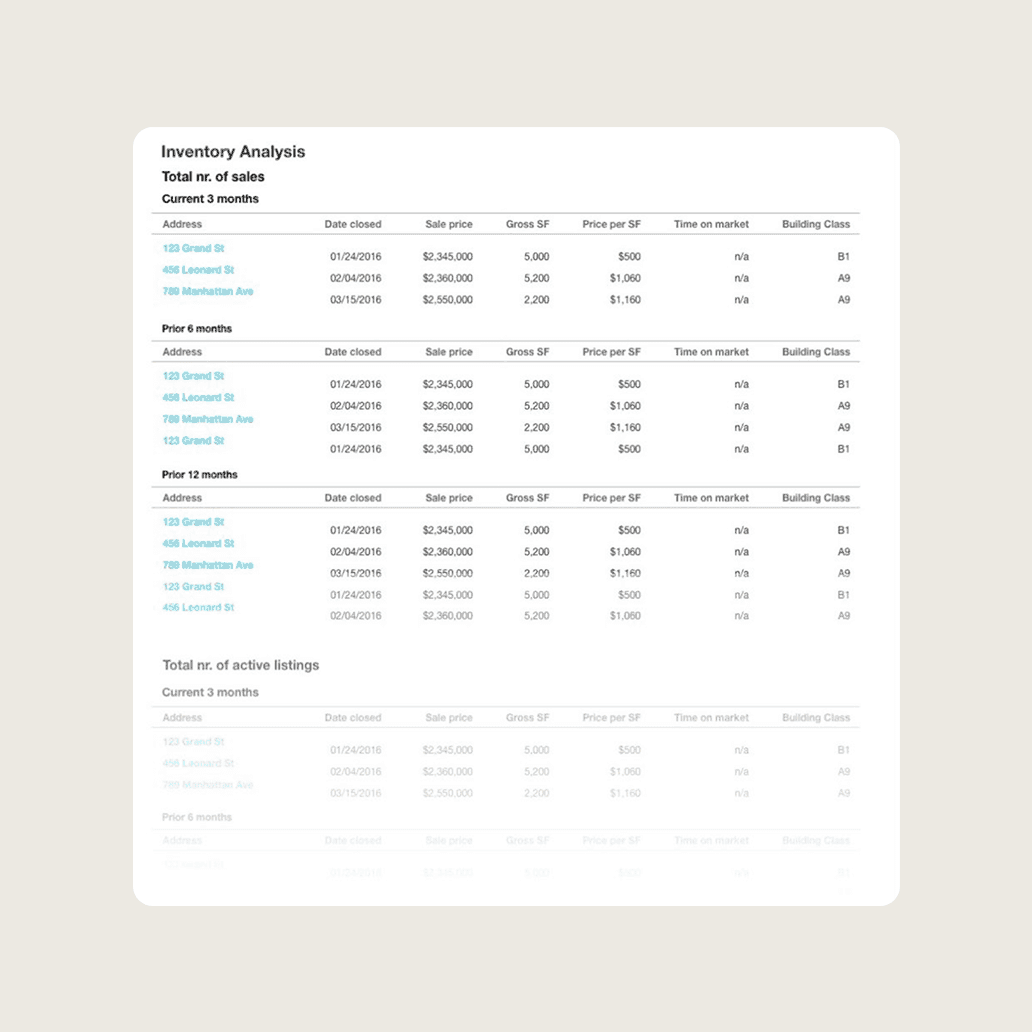
Convert fragmented files into structured assets
Translate messy PDFs and images into clean, categorized Excel workbooks. Eliminate manual data entry and automate reconciliation in minutes.
Decipher and compare intricate legal frameworks
Audit and compare regulatory requirements across different jurisdictions. Turn overwhelming legal documentation into clear, interactive executive summaries.

Fig powers a data analyst’s every needs
Pull insights from your warehouse and push processed results back to your tools, with no manual exports or context switching required
Slides
Generate polished insight presentations from your findings. Fig handles the narrative flow and layout so your data stories land with stakeholders.
Design
Describe the trend you found and get publish-ready infographics and charts. No manual tweaking in BI tools required, just results in minutes.
Video
Produce tutorial videos or data methodology walkthroughs from your scripts. Add automated captions and screen transitions to explain your models.
Websites
Build data catalogs, API documentation sites, and branded internal portals. No code or staging needed, just instant deployment for your team.
Web Search
Let Fig browse the web on your behalf to pull public datasets, scrape directories, or monitor API changes. Fully hands-free data collection.
Data
Turn raw datasets into clear, presentation-ready charts and dashboards. Spot trends, compare segments, and share insights at record speed.
Spreadsheet
Clean, enrich, and transform raw data across CSVs and Excel. Build complex formulas, pivot tables, and cleaning scripts automatically.
Deep Research
Deploy hundreds of AI agents in parallel to tackle large-scale tasks like schema mapping, anomaly detection, or data labeling in minutes.
Skills
Extend Fig with reusable workflows for SQL optimization, data cleaning, and periodic reporting. Build once, run on every dataset.
Connectors
Plug into Snowflake, BigQuery, and Looker. Fig reads your metadata and writes summaries back where your team already collaborates.