See what finance teams do with Fig
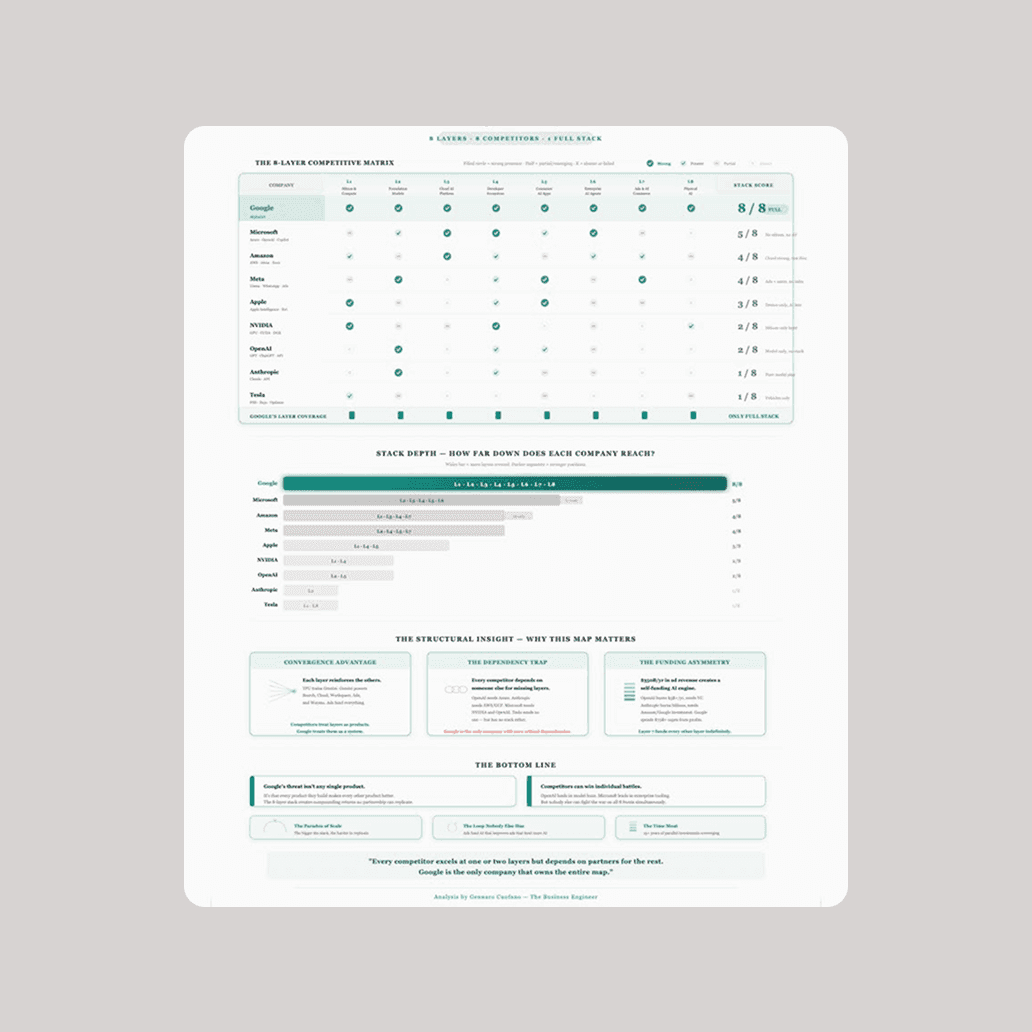
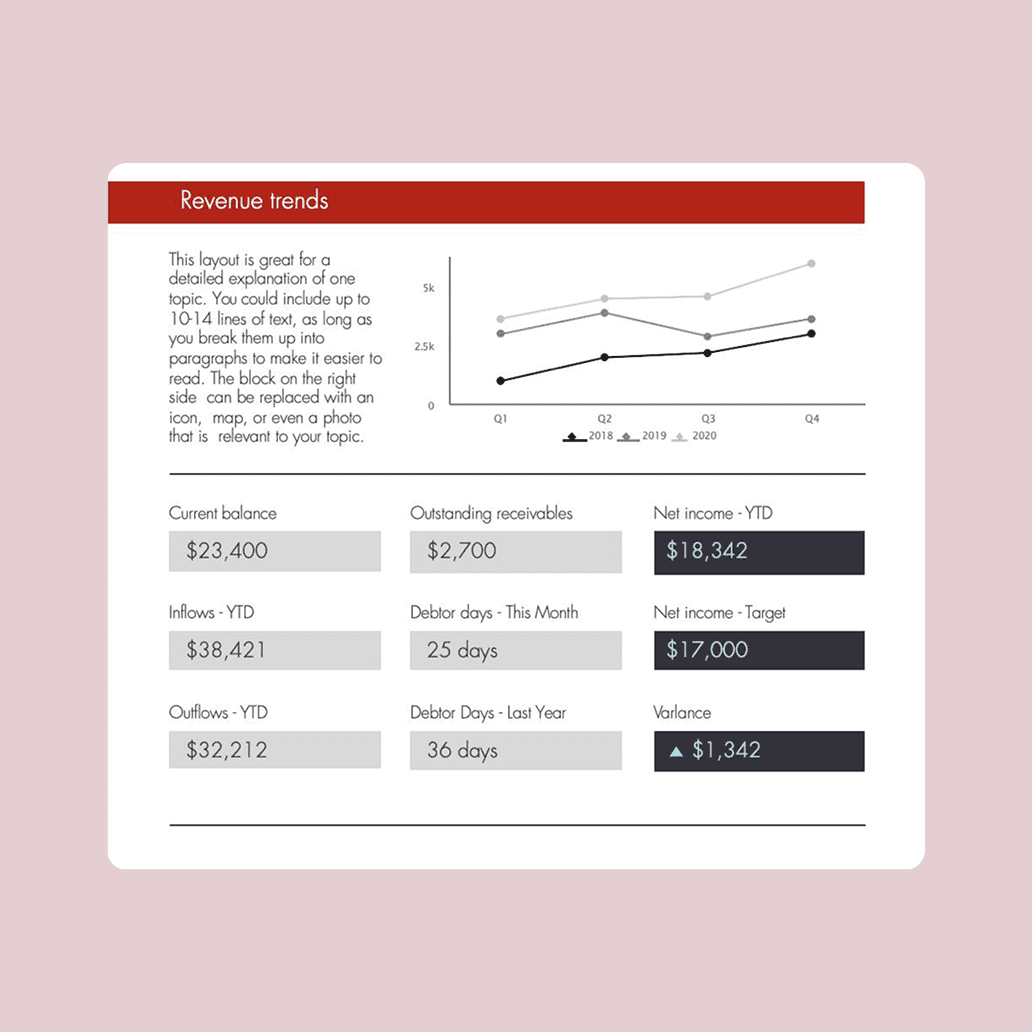

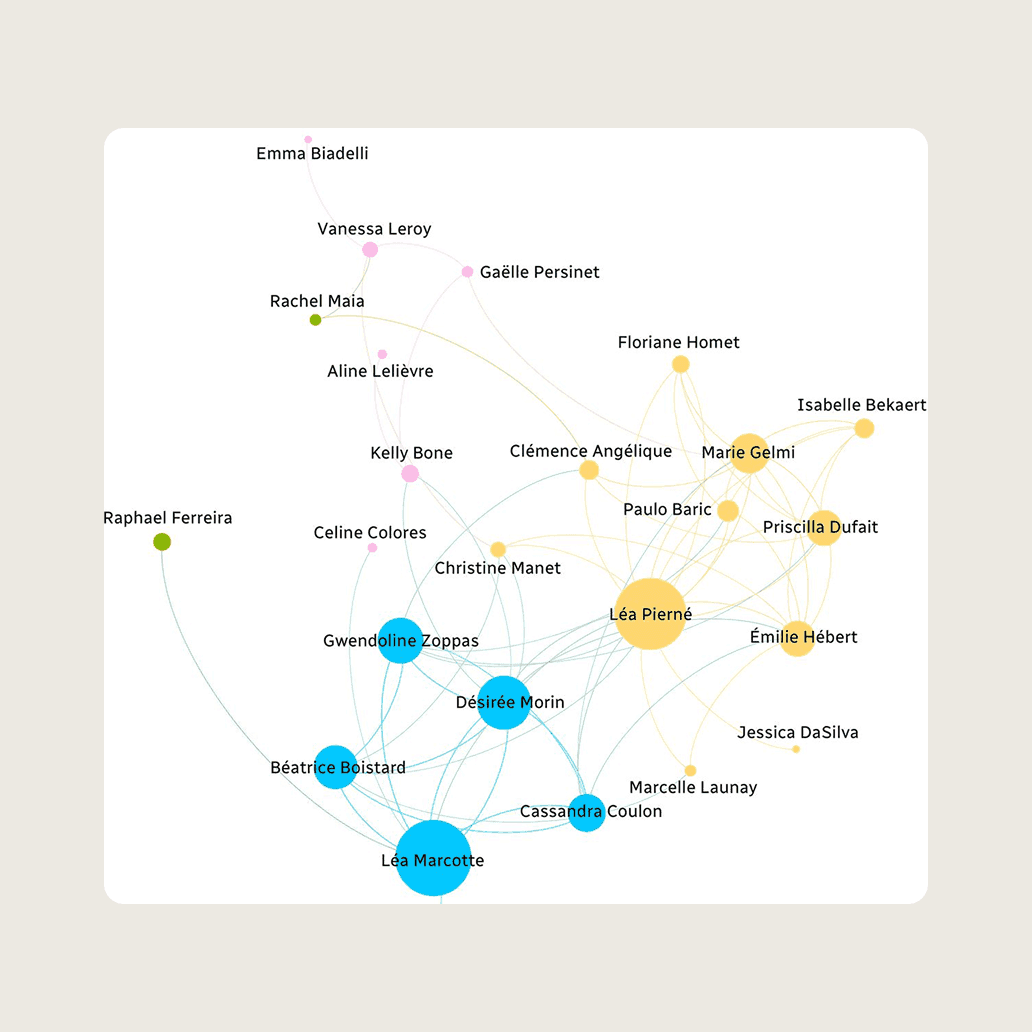

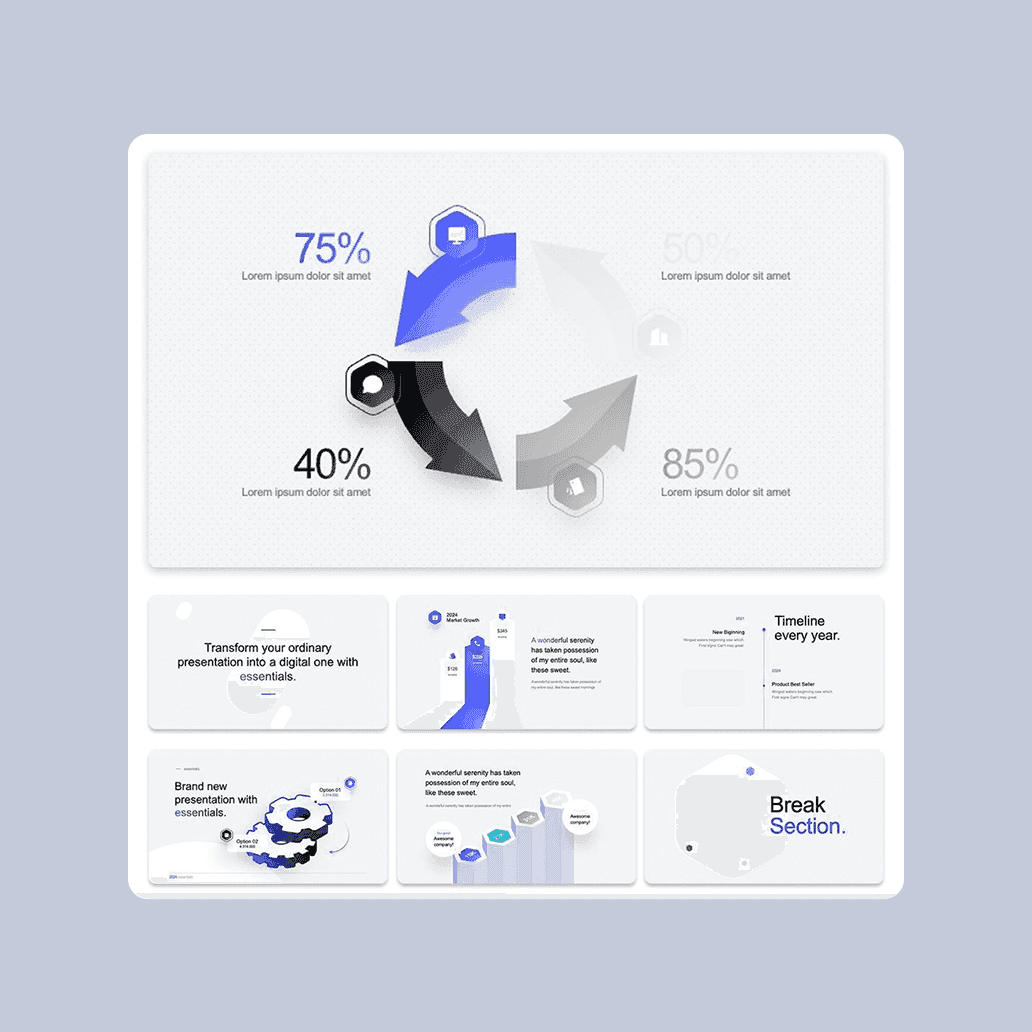
Real-Time Analytics. Execute technical analysis across various timeframes for any security and generate live, interactive web reports to visualize findings instantly.
Only Fig Can Do
Master sophisticated, end-to-end financial workflows beyond the reach of standard AI. Move from raw data to finalized deliverables with one single prompt
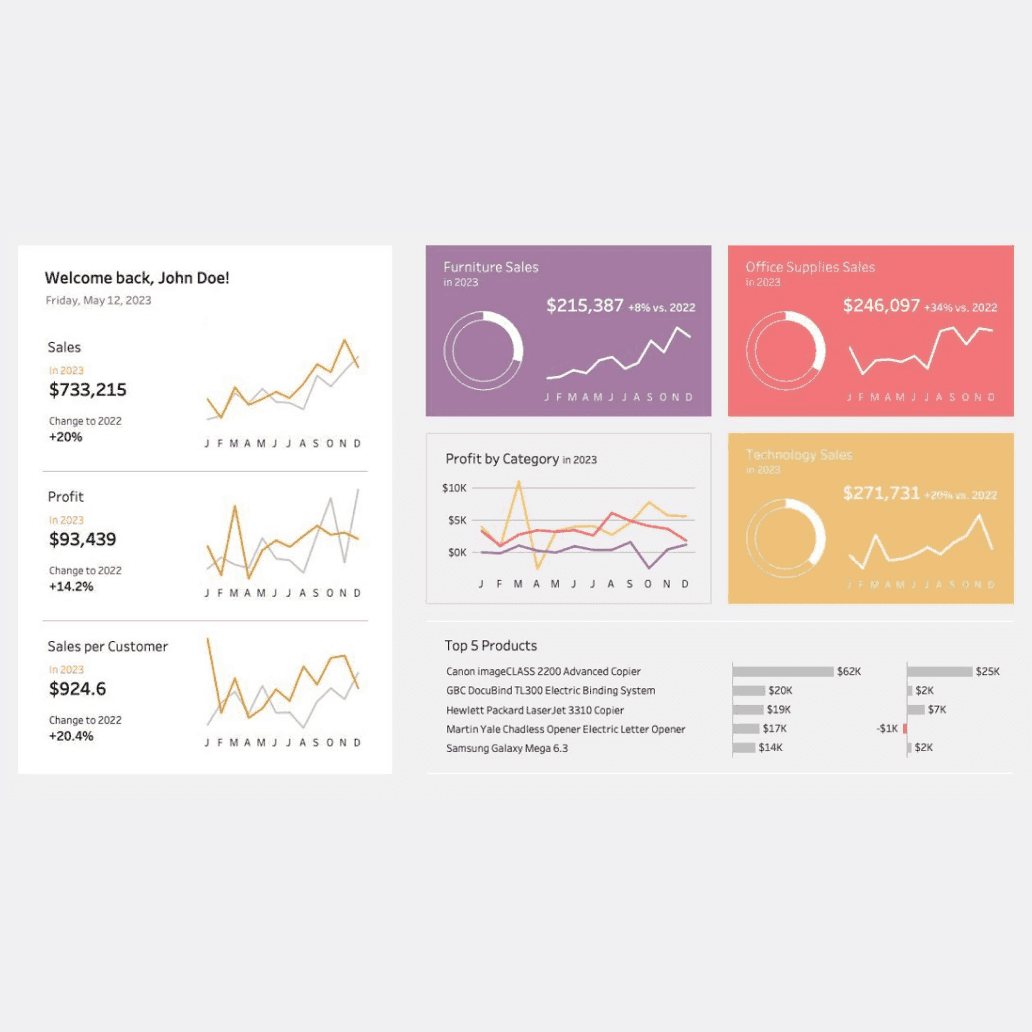
Evaluate equities with real-time market data
Construct dynamic dashboards featuring live market feeds. Compare corporate performance and stock indicators side-by-side to pinpoint emerging trends.
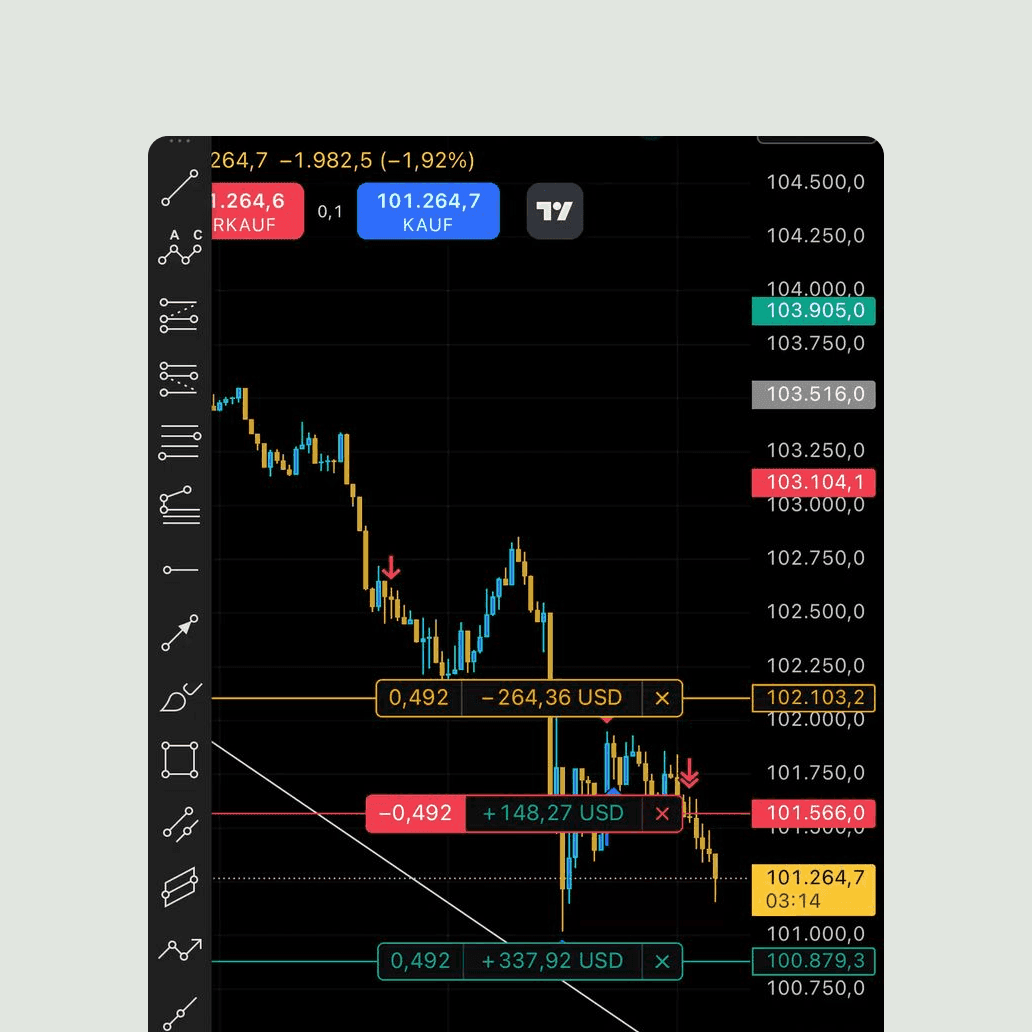
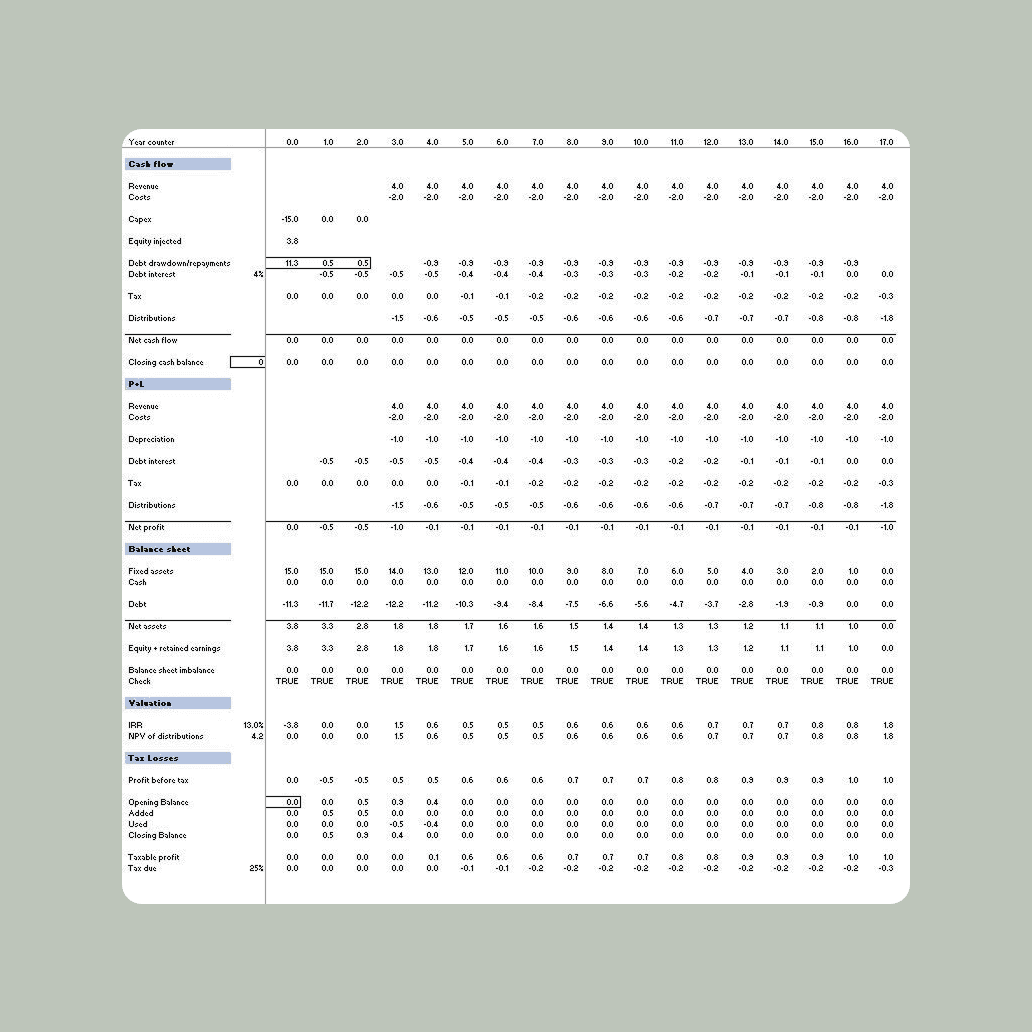
Generate comprehensive financial forecasts
Develop dynamic P&L, cash flow, and balance sheet projections. Model intricate business scenarios and visualize the immediate impact on your bottom line.
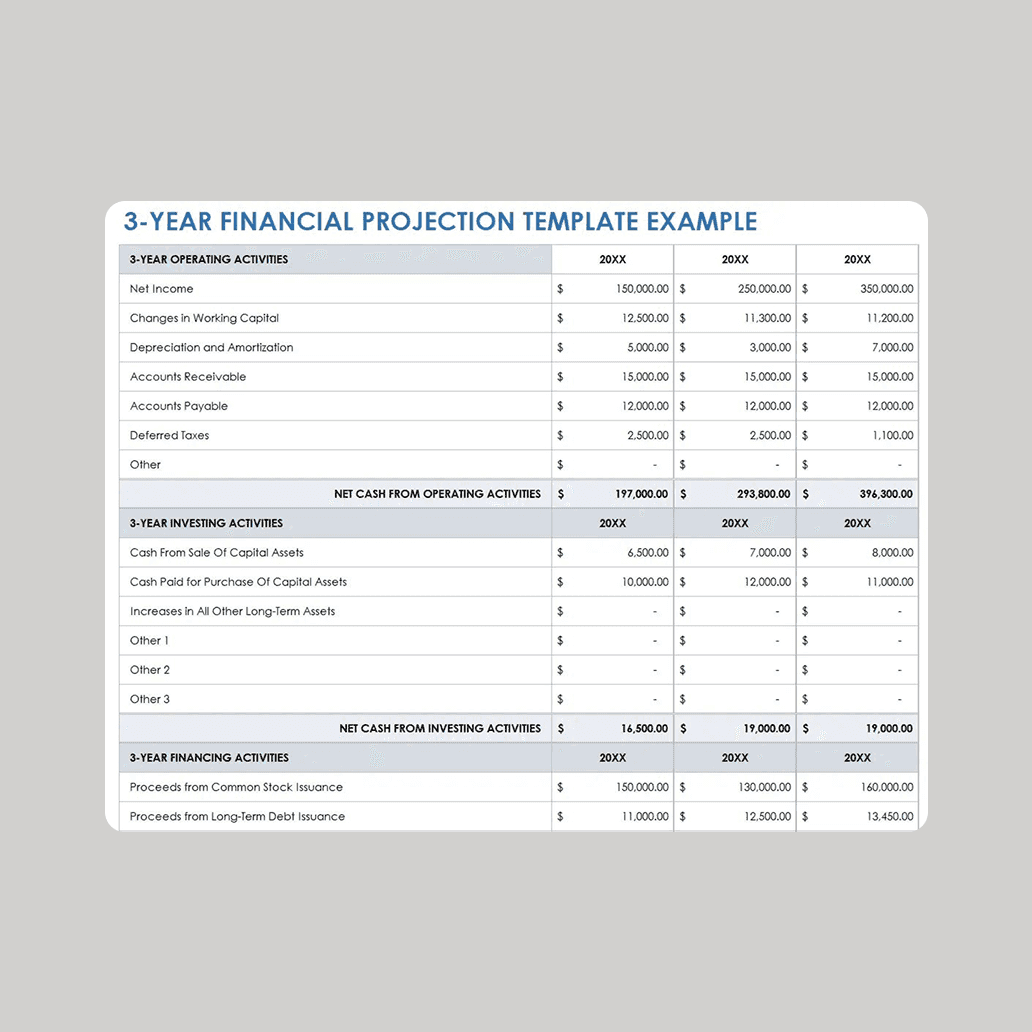
Develop interactive financial utilities
Build and launch bespoke calculators, such as tax estimators for independent contractors, featuring multi-lingual support and visual analytics.
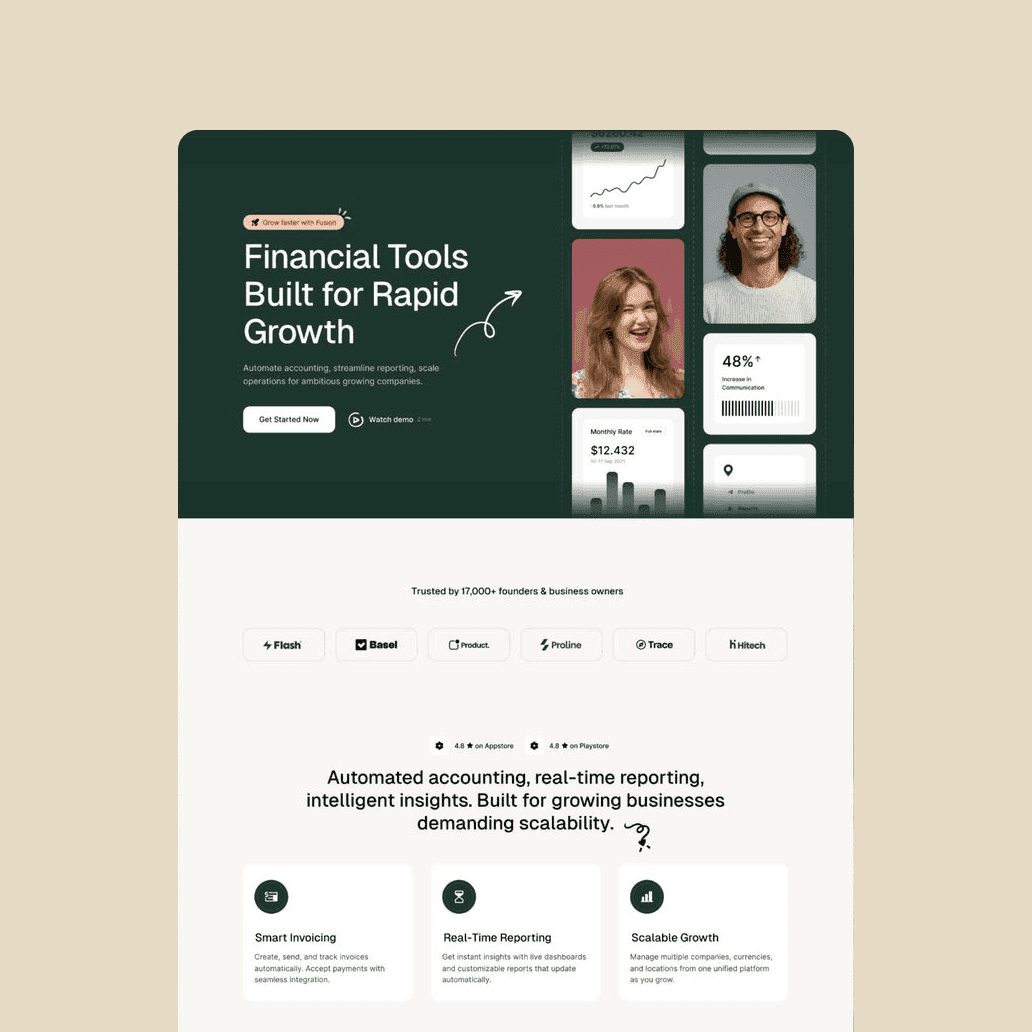
Project future corporate valuations
Transform annual reports into rigorous valuation models, complete with sensitivity analysis and executive formatting, in mere minutes.
Streamline expense auditing and reporting
Automatically classify financial transactions from any data source to produce in-depth expense summaries enriched with charts and strategic insights.
Simulate intricate equity structures instantly
Visualize how investment rounds and option grants impact your cap table with an interactive suite that compares dilution scenarios side-by-side.
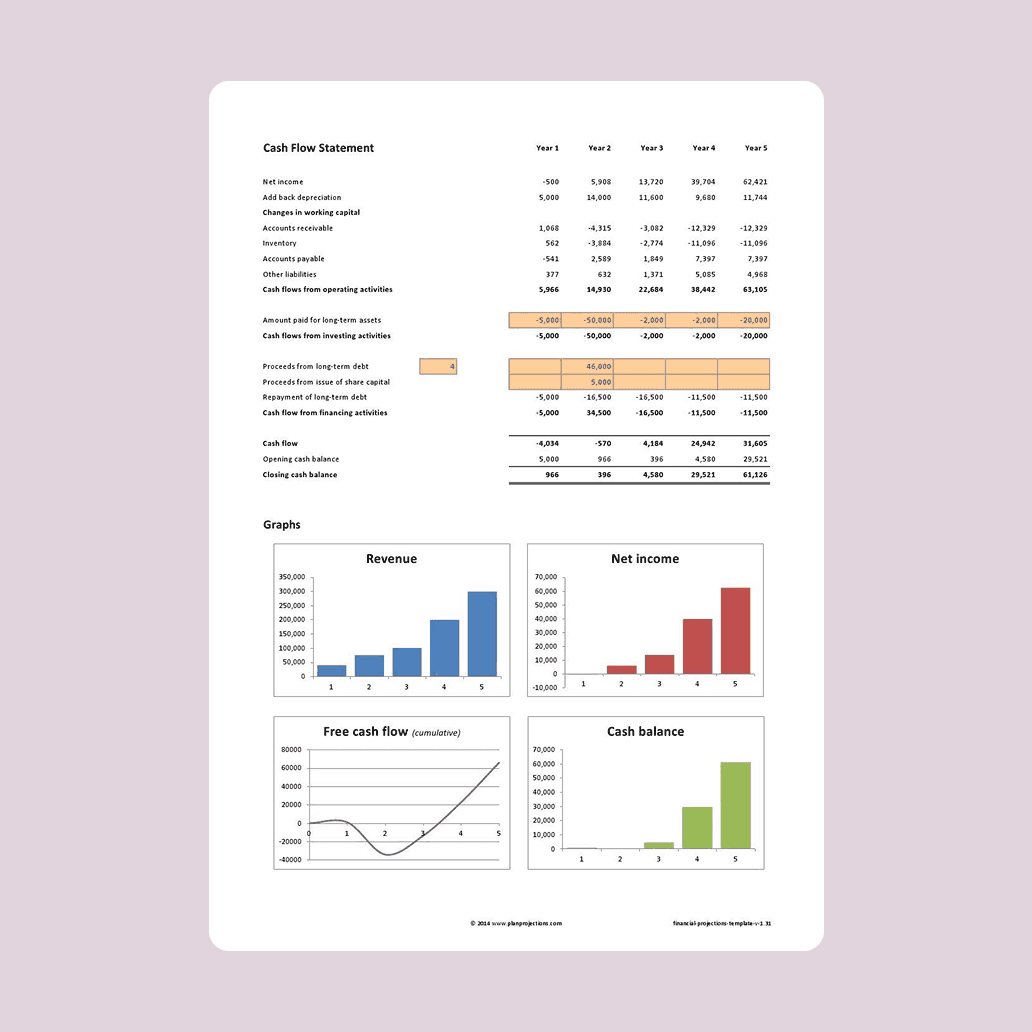
Fig powers a finance team’s every needs
Pull insights from your finance stack and push entries back to your ERP, with no manual exports, no copy-pasting, no context switching
Slides
Generate polished board decks and quarterly reviews from raw data. Fig handles the layout and variance charts so your narrative lands every time.
Design
Request specific P&L summaries or spend infographics. Get board-ready visuals in minutes without manual formatting in Excel.
Video
Produce internal training videos and compliance demos from your policy docs. Add captions and clear audio to ensure your team stays up to date.
Websites
Build landing pages for expense policies or branded internal tools for budget requests. Go live instantly with no help from IT.
Web Search
Let Fig browse the web to pull market indices, scrape pricing data, or monitor regulatory updates. Fully hands-free market intelligence.
Data
Turn raw transaction data into clear, presentation-ready charts. Spot anomalies, compare spend across departments, and share insights fast.
Spreadsheet
Clean, enrich, and analyze financial data across CSVs and Excel. Build formulas, pivot tables, and audit summaries automatically.
Deep Research
Deploy hundreds of AI agents in parallel to tackle large-scale tasks like transaction auditing or vendor risk assessments in minutes.
Skills
Extend Fig with workflows for tax prep, budget forecasting, and payroll audits. Build your framework once and run it every month.
Connectors
Plug into NetSuite, QuickBooks, and Excel. Fig reads your ledger data and writes reconciliations back where your records already live.