Clinical trial site identification
Site identification for clinical trials: countries on a world map shaded by patient population for the indication, each country's profile with sites, investigators and competing trials, the sites in it with MRI, X-ray and genomic access, cost per subject, quality, potential, retention and diversity scores under filters, sites added to a list, and an analyze step that scores the selection and sends feasibility.
One working session with the people in the seat: which decisions, which systems, what a good week looks like.
The app you see above, running on your own exports instead of the simulated world. Every screen, every decision, your numbers.
Wired to your systems with your permissions, agents proposing, people approving, the ledger recording who did what.
Overview
Choosing sites for a trial means reconciling the CTMS, the CRO's feeds, past performance and registries by hand, country by country. Slow-activating sites and high screen-fail rates are discovered after the study starts.
The app unifies site and investigator data into one repository and shows it on a map by patient population for the indication. A country opens its profile and its sites with access to equipment, cost per enrolled subject, quality, estimated potential, retention and diversity; filters narrow them and the chosen sites go to a list. The analyze step scores the list, estimates enrolment and cost, flags retention risk and sends pre-filled feasibility questionnaires to the CRO.
Key features
- Unified site and investigator repository: CTMS, IRT, EDC, CRO feeds and registries in one view.
- AI-driven site identification: performance metrics on speed, enrolment and quality per site and investigator.
- Dynamic performance evaluation and study financial planning: cost implications by country and site.
- Site feasibility: pre-filled questionnaires and collaboration with CROs and sites.
Decisions it produces
- Open a country and review its profile
- Add sites to the list
- Validate the list and send feasibility
- Compare country cost implications
Data sources
| CTMS | sites, investigators, activation times |
|---|---|
| EDC/IRT | enrolment, screen failures, deviations |
| Registries | competing trials, marketed drugs |
| Budgets | cost per enrolled subject by site and country |
Simulated data throughout. Book a call to see it on your own systems.
Related demos
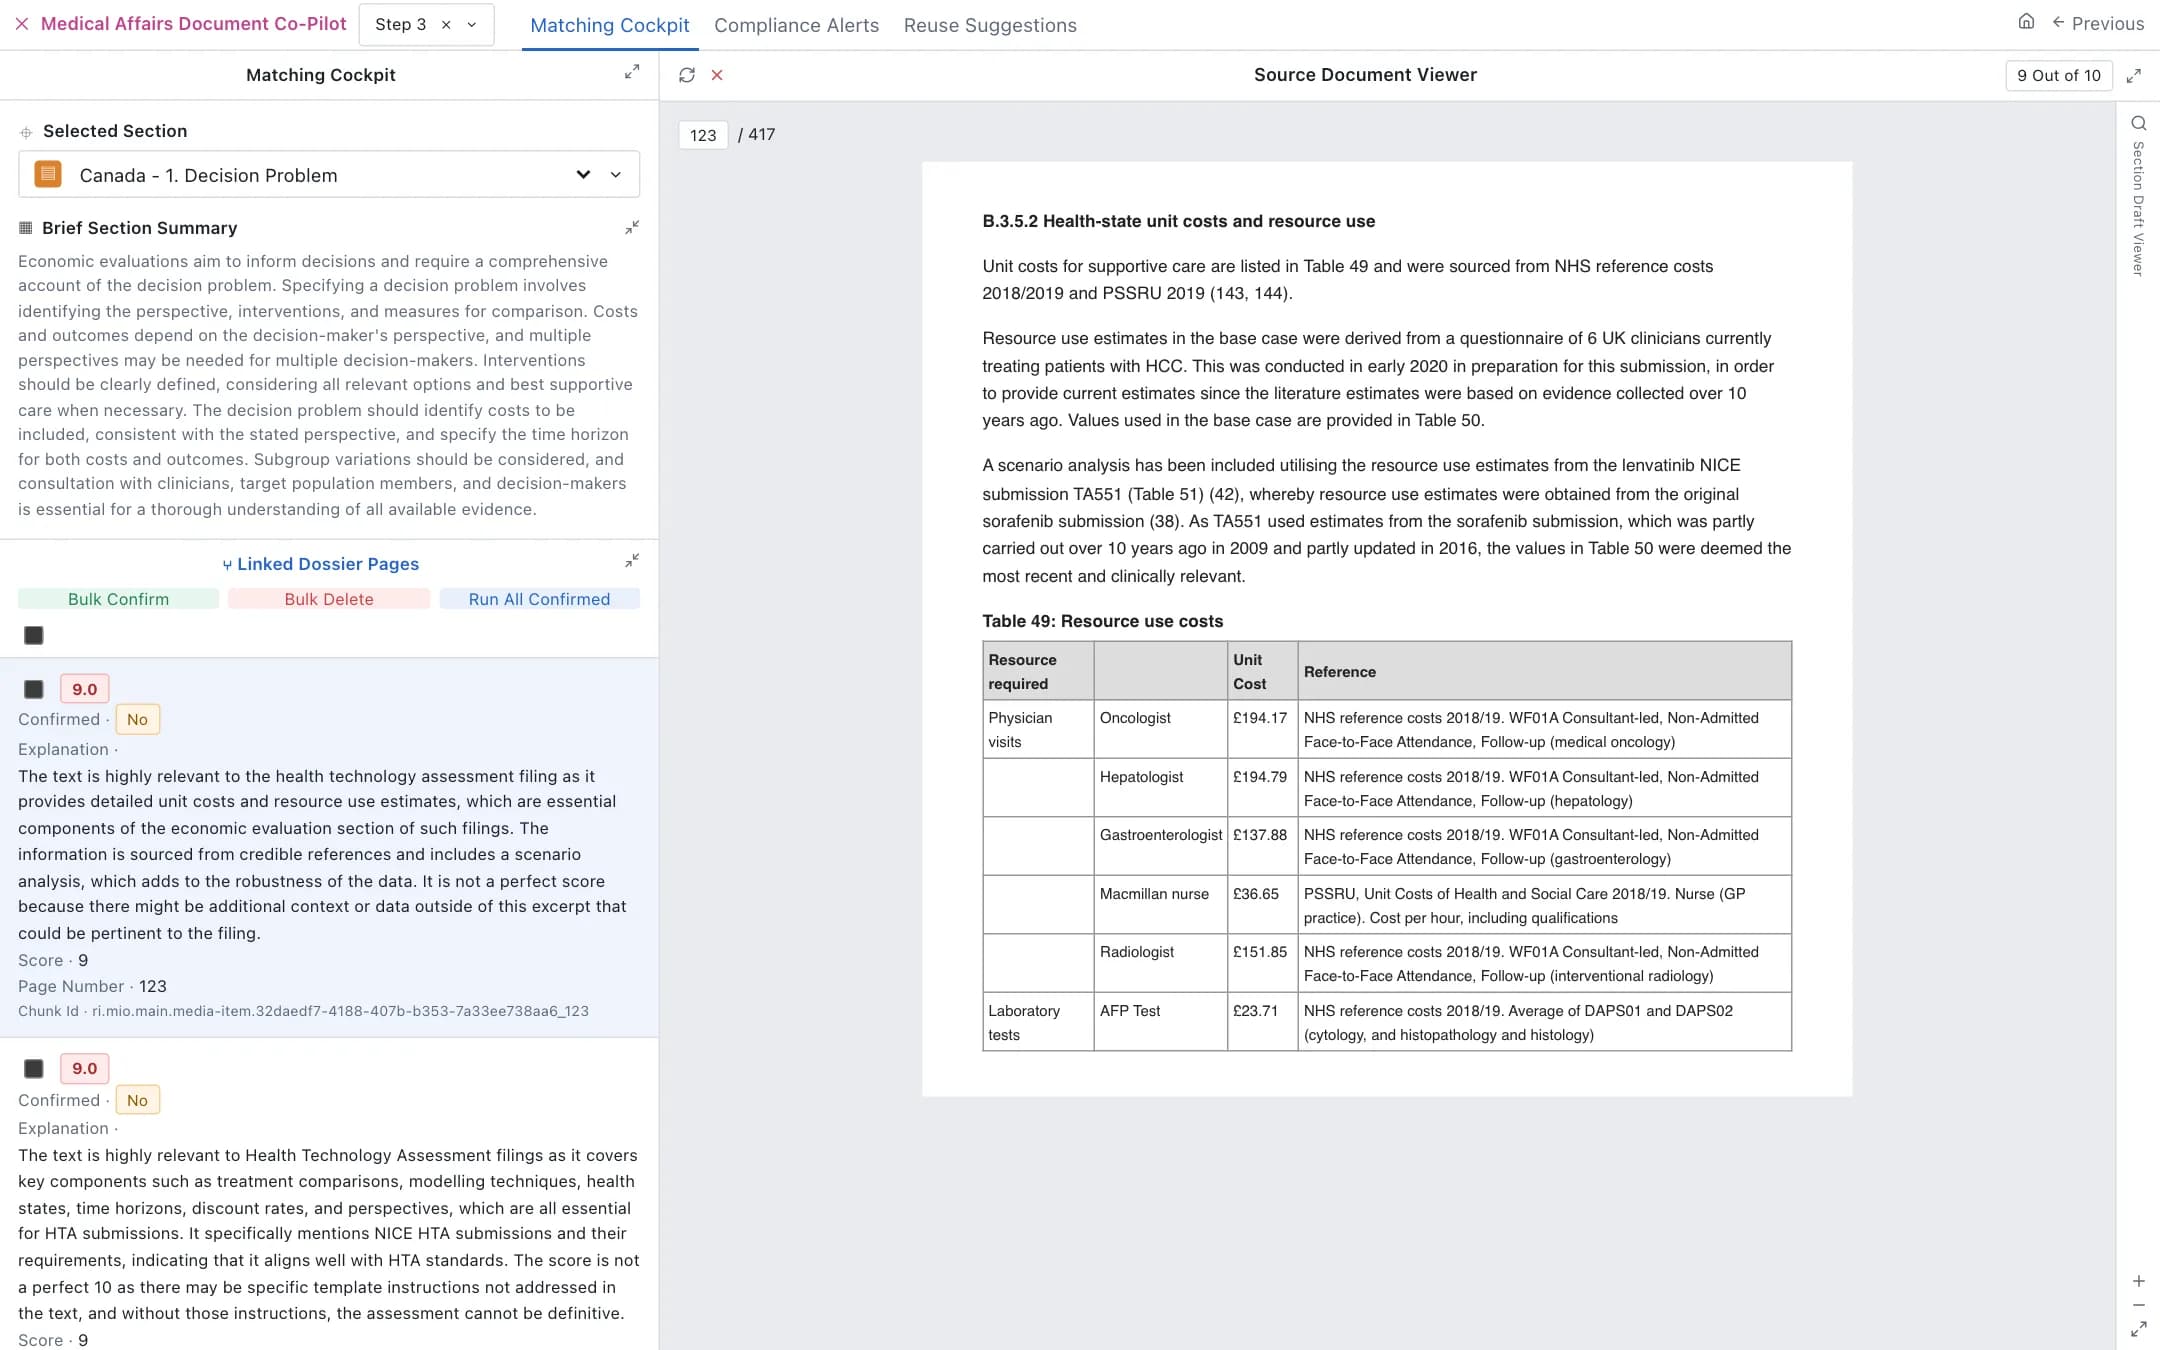
Medical affairs material review
A document co-pilot for medical affairs: a matching cockpit that maps each section of a health technology assessment template to the pages of the evidence dossier with a relevance score and explanation, confirmed or deleted in bulk beside the source document, compliance alerts from a versioned rule library, and reuse suggestions from approved content.
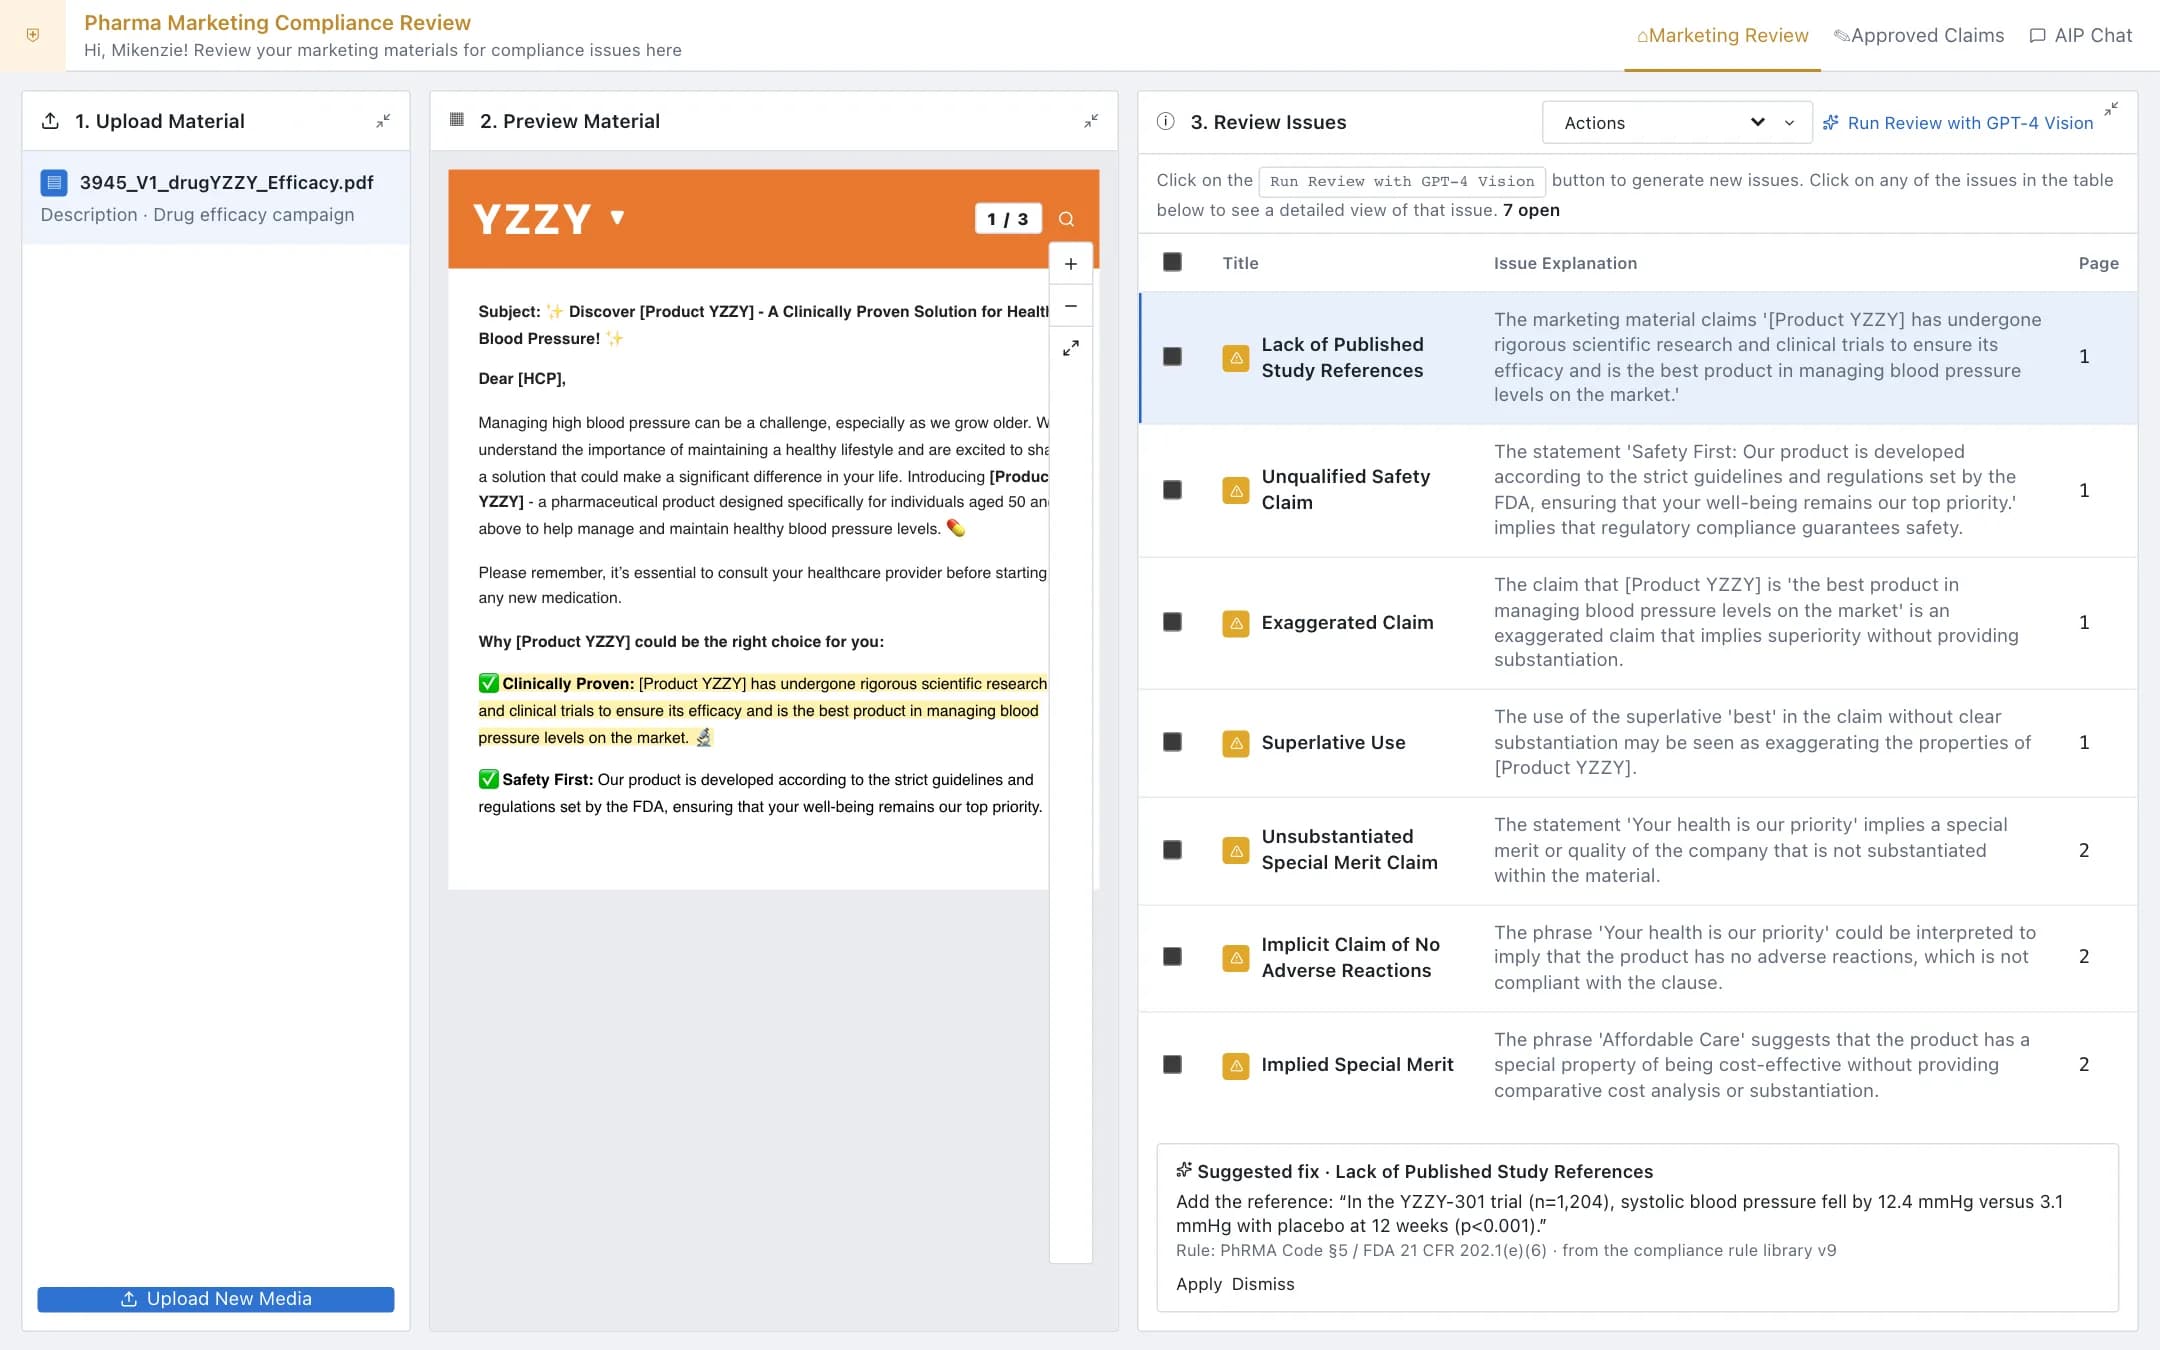
Pharma marketing review
Compliance review for pharma marketing materials: upload a brochure, email or advertisement, preview it, run the vision review against a versioned rule library covering FDA regulations and the PhRMA Code, and work through the issues with the exact claim, the rule and a suggested fix, plus an approved claims library for reuse and localisation and a chat over the regulations.
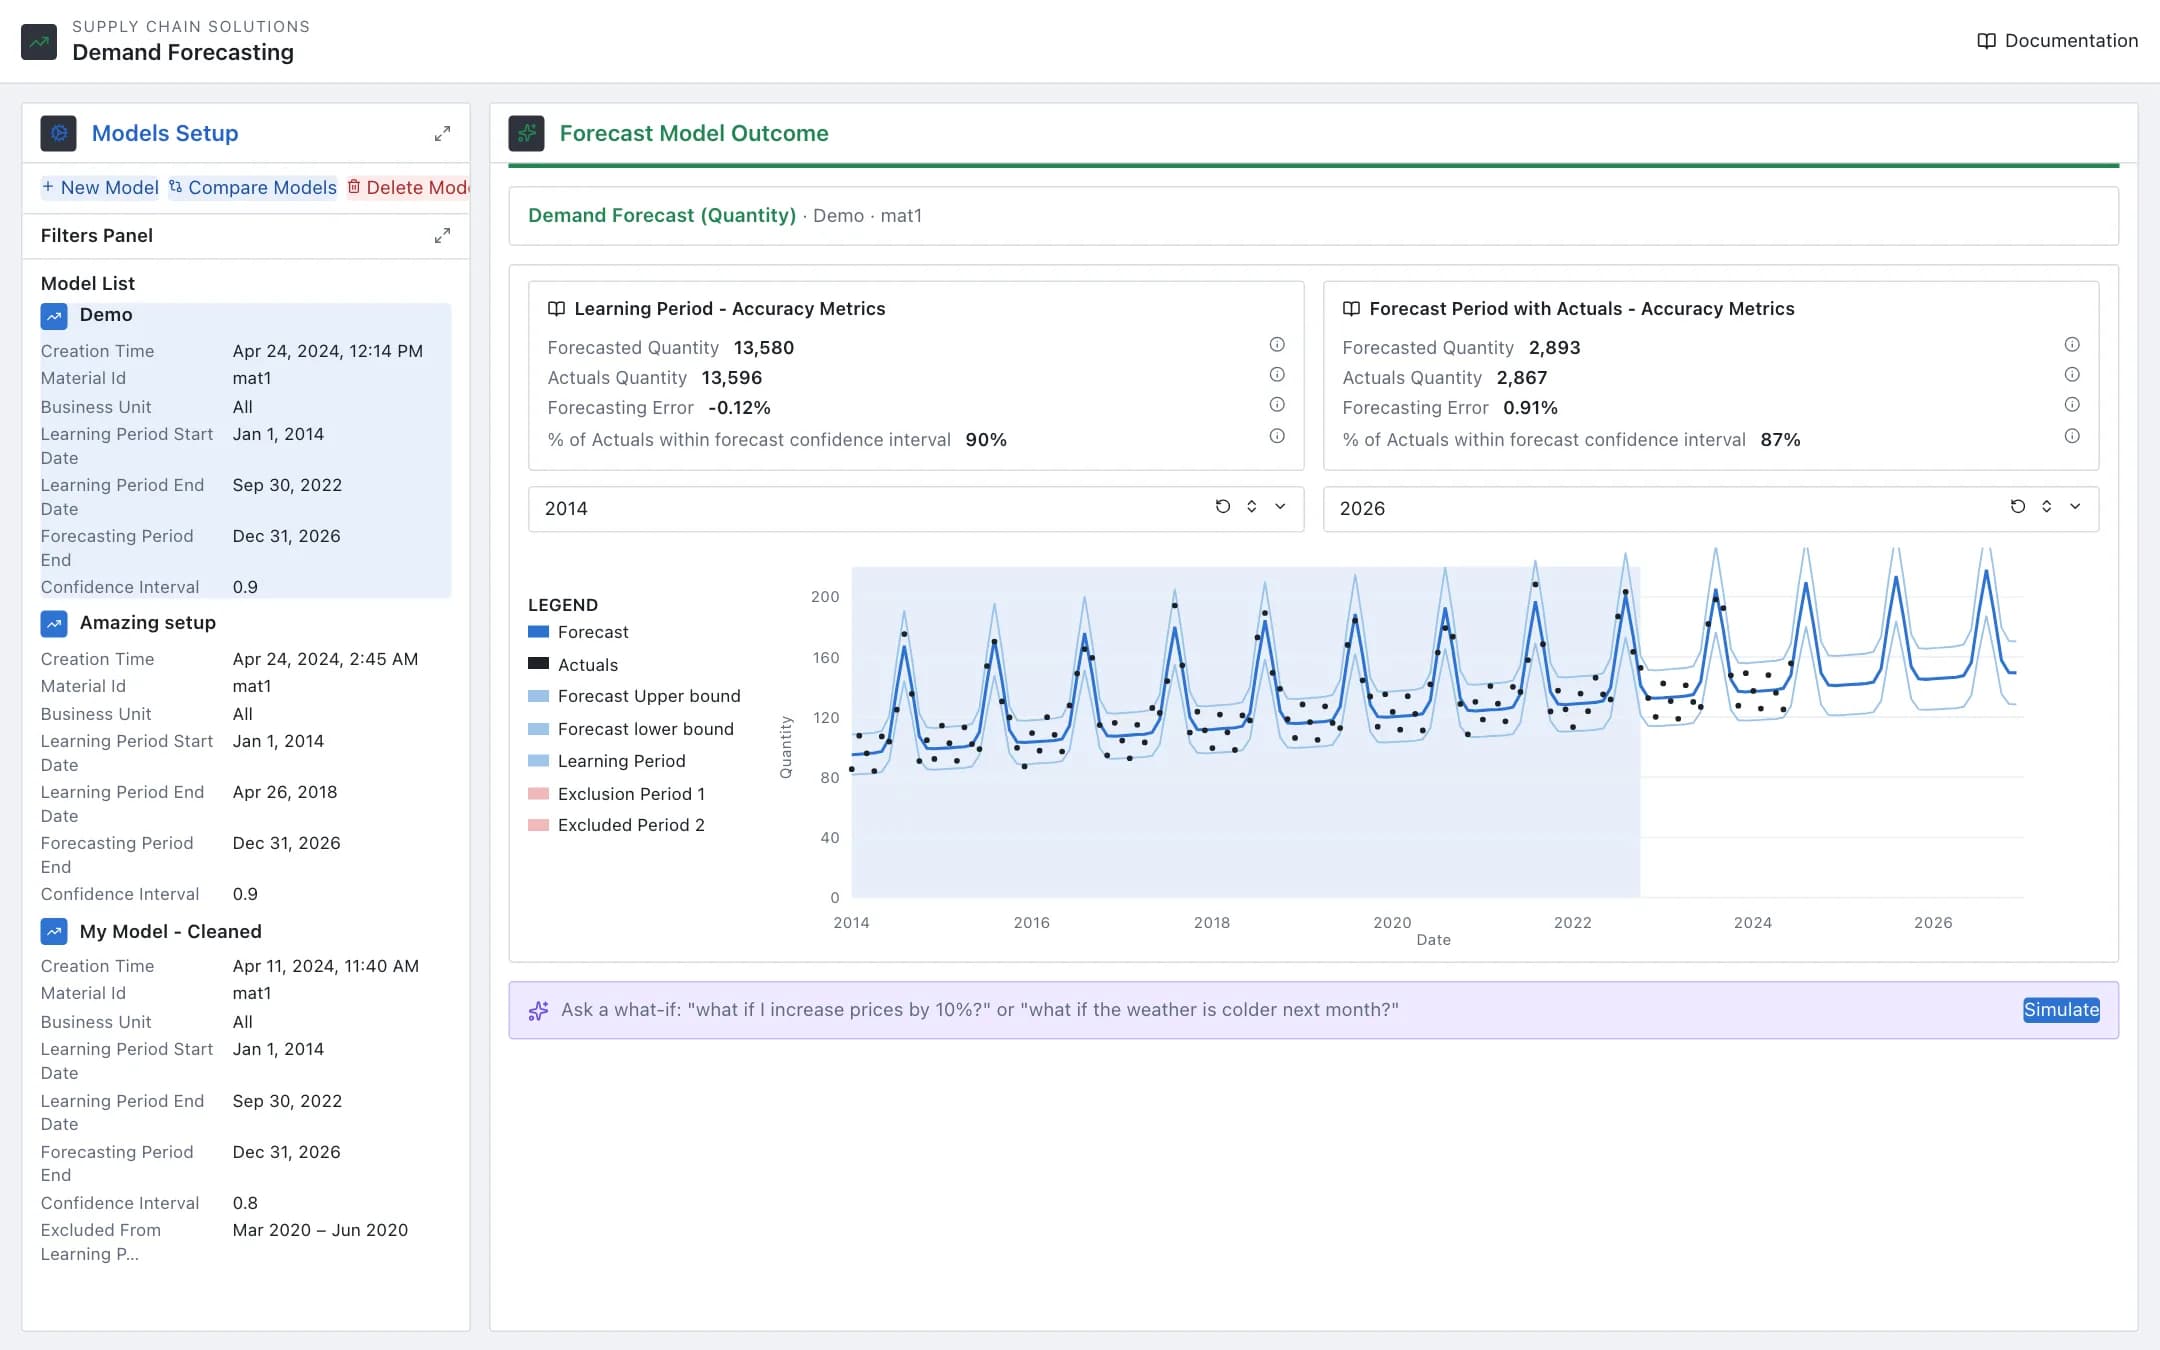
Demand forecasting
Forecast models per material and business unit with a learning period, exclusions and price assumptions; the outcome shows the seasonal forecast against actuals with accuracy metrics, models compare side by side, and a plain-language what-if re-runs the forecast.