Students slipping, and what we did about it
Engagement signals from four systems (LMS activity, missing work, card swipes, no-shows, holds) on every student, cases with an owner and an outcome, and what works: which interventions moved retention.
A sample of the app on simulated data. Book a call to click through it live, or to see it on your own exports.
One working session with the people in the seat: which decisions, which systems, what a good week looks like.
The app you see above, running on your own exports instead of the simulated world. Every screen, every decision, your numbers.
Wired to your systems with your permissions, agents proposing, people approving, the ledger recording who did what.
Overview
Not a risk score. A queue of what changed for each advisor's advisees this week, with the evidence, and a case that lands on the student's record and on a board.
Decisions it produces
- Assign stale alerts
- Campaign on holds
- Check in on the quiet
- Close a case with an outcome
The world it runs on
A simulated residential liberal arts college of 2,400 students: 8,000 applicants, 30,000 alumni, twelve vendor-shaped source systems (student information, admissions CRM, LMS, HR and finance, advancement CRM, card system) and 2.1 million rows of mock data resolved into one ontology.
Every company, person and number in this demo is simulated; anchors are public facts or plausible for the segment. Substitute your own feeds and the same apps run on your operation, with your permissions.
Related demos
Shaping the class under a tuition cap
The fall class against a headcount and net-tuition target: pipeline by income band, aid levers, territories, and the family questions with a drafted reply that computes the tuition cap from stated income.
Seats short for spring, seniors without a capstone
The spring schedule draft by department against demand from last spring, seniors against capstone seats, faculty load and cost per seat, with the fix on each shortfall: open a section with the lightest-loaded instructor and a free room.
 Production ready in 12 days
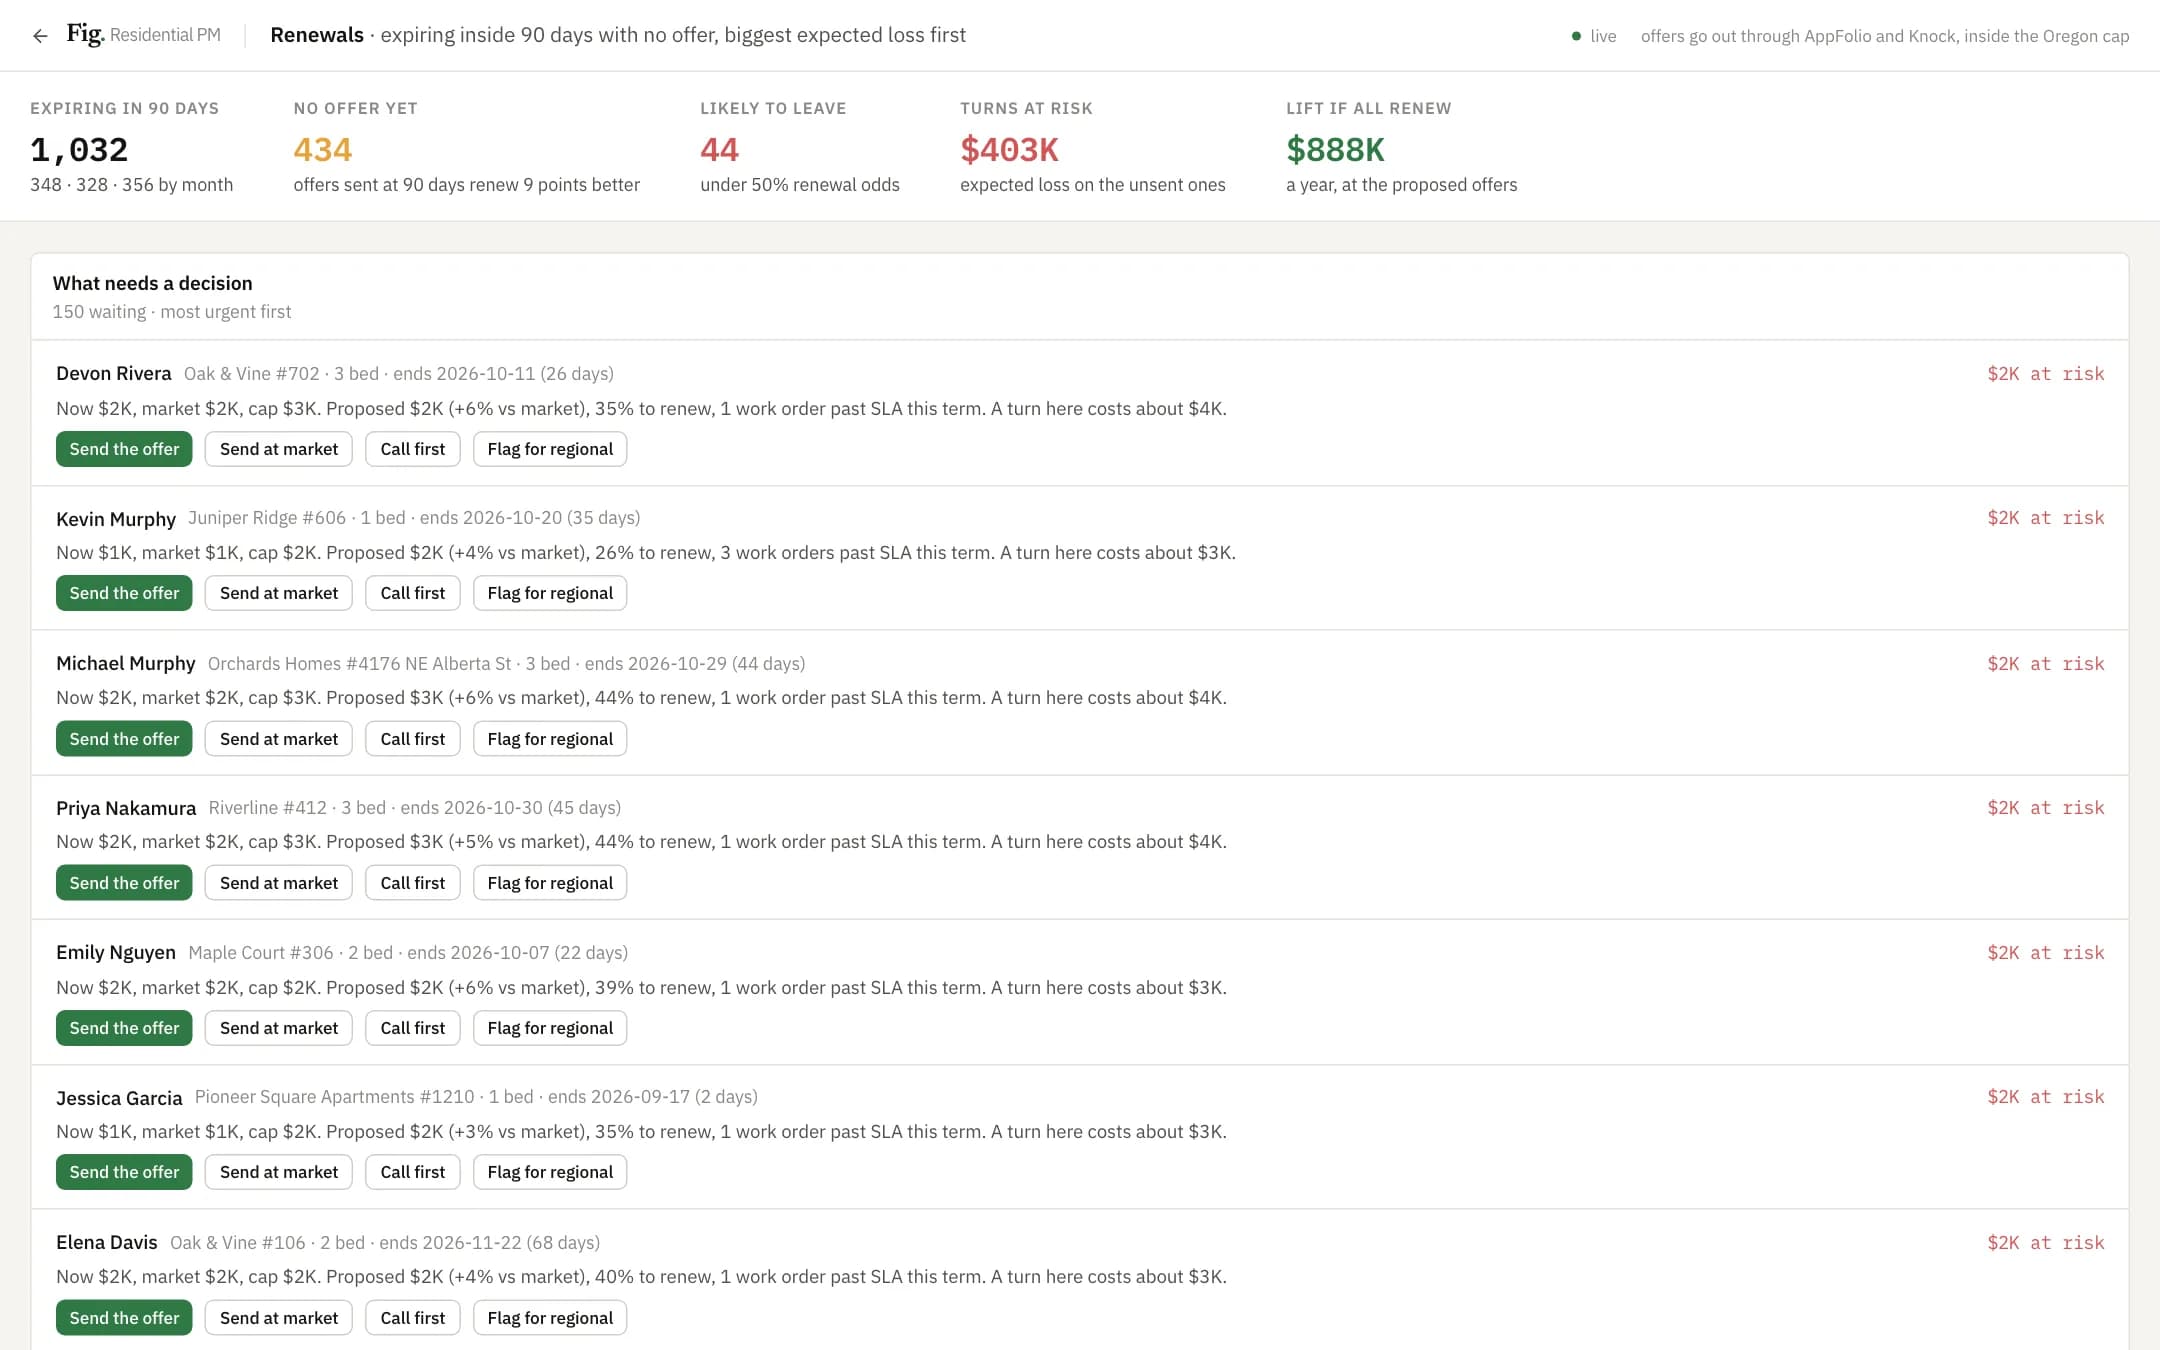
Leases expiring in 90 days, priced by feel
A 30 / 60 / 90 timeline where every expiring lease is a card with current rent, the submarket median, the proposed offer inside the legal cap, and the odds of renewal at that price.