Product cost 360
Product Cost 360: the landed cost of one product broken into shipment, storage and vendor price against its selling price, an Fig summary of the biggest driver, shipment arcs from vendors to distribution centers on the map, storage cost by location and vendor comparison, and move inventory, change vendor and change carrier actions that re-price the product live.
One working session with the people in the seat: which decisions, which systems, what a good week looks like.
The app you see above, running on your own exports instead of the simulated world. Every screen, every decision, your numbers.
Wired to your systems with your permissions, agents proposing, people approving, the ledger recording who did what.
Overview
A product's cost is scattered: the vendor invoice in the ERP, freight in the transport system, storage in the warehouse system, taxes and licences elsewhere. Nobody sees what a unit really costs by the time it reaches the shelf.
The app follows every dollar from the vendor invoice to the price tag, consolidating purchase orders, sales orders, shipments and inventory into one view per product. The breakdown shows the biggest driver with a plain-language summary; the shipment, storage and vendor pages show where the cost is incurred, and the actions to move inventory, change vendor or change carrier re-price the product before the change is sent to the source systems.
Key features
- Transparent cost tracking: every cost from the initial vendor invoice to the final price tag.
- Opportunity insights: hidden inefficiencies in vendor terms, routing and inventory levels, with suggested actions.
- Supply chain optimization: vendor, carrier and inventory decisions evaluated on cost without compromising delivery.
- Inventory management efficiency: inventory levels adjusted from history to reduce holding cost.
Decisions it produces
- Move inventory between locations
- Change the vendor for a product
- Change the carrier on open shipments
- Apply the Fig recommendation
Data sources
| ERP | purchase and sales orders, vendor prices |
|---|---|
| WMS | inventory by location and dwell |
| TMS | shipments and freight cost |
| Contracts | vendor terms, licences, taxes |
Simulated data throughout. Book a call to see it on your own systems.
Related demos
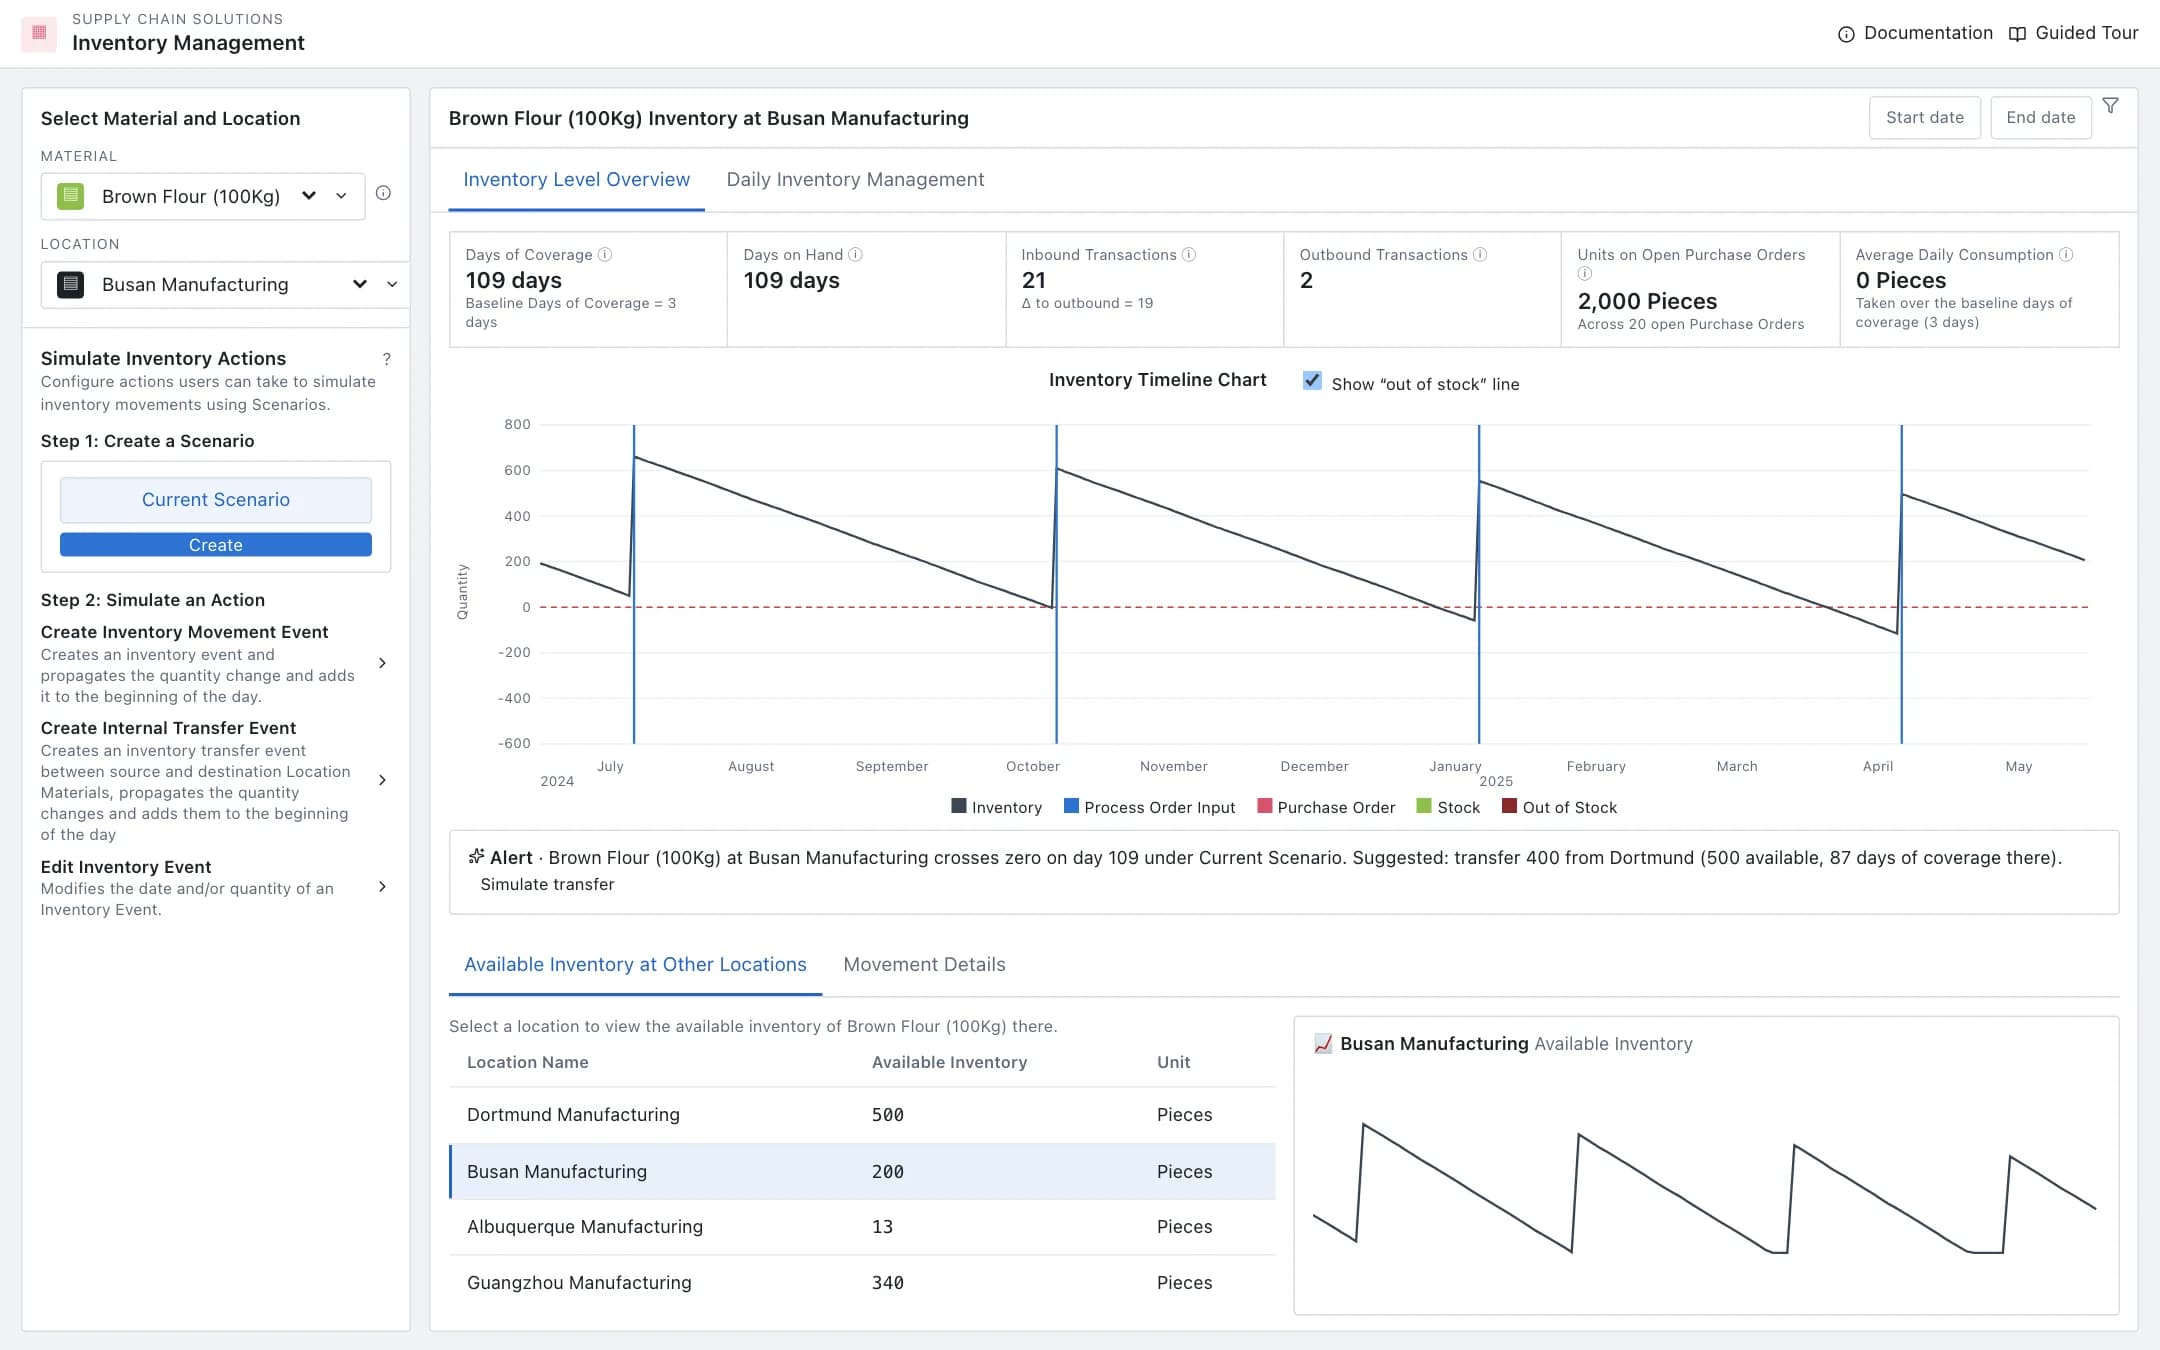
Inventory management, visibility and simulation
Inventory visibility and simulation: a material at a location with days of coverage, transactions and open orders, the inventory timeline with the out-of-stock line, the daily inventory table, available inventory at other locations, and scenarios that simulate movements, transfers and edits against the timeline before the operator commits them.
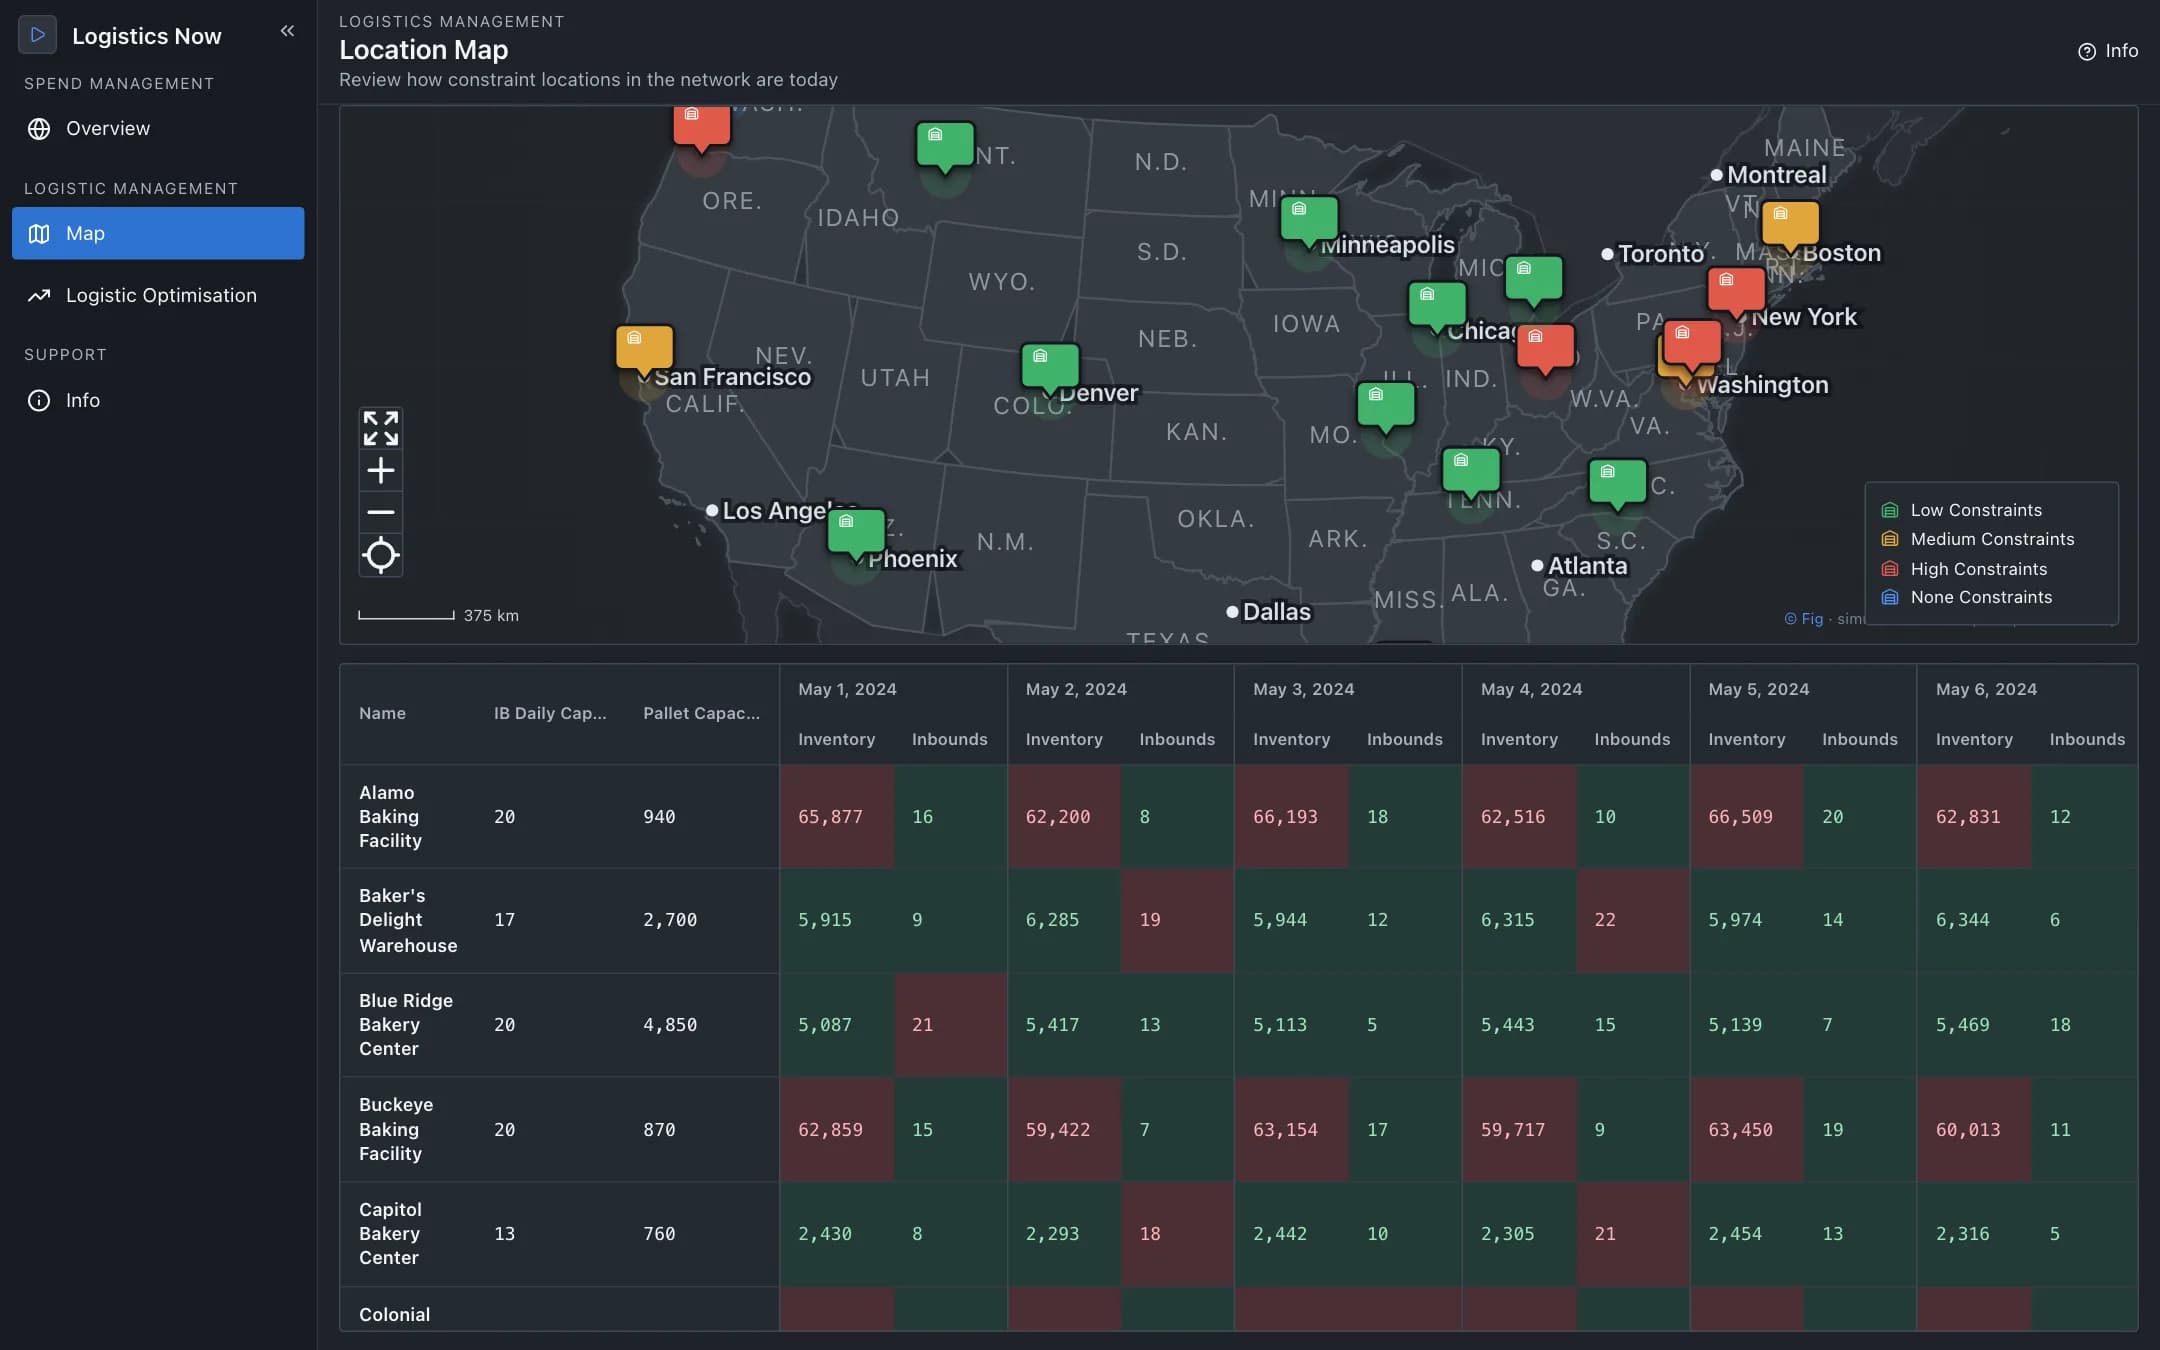
Supply chain logistics
A control tower for the distribution network: sites on a map coloured by constraint with day-by-day inventory and inbound capacity, a linear optimiser's stock-transfer recommendations to accept with ERP write-back or reject with a reason, and a spend and acceptance tracker.
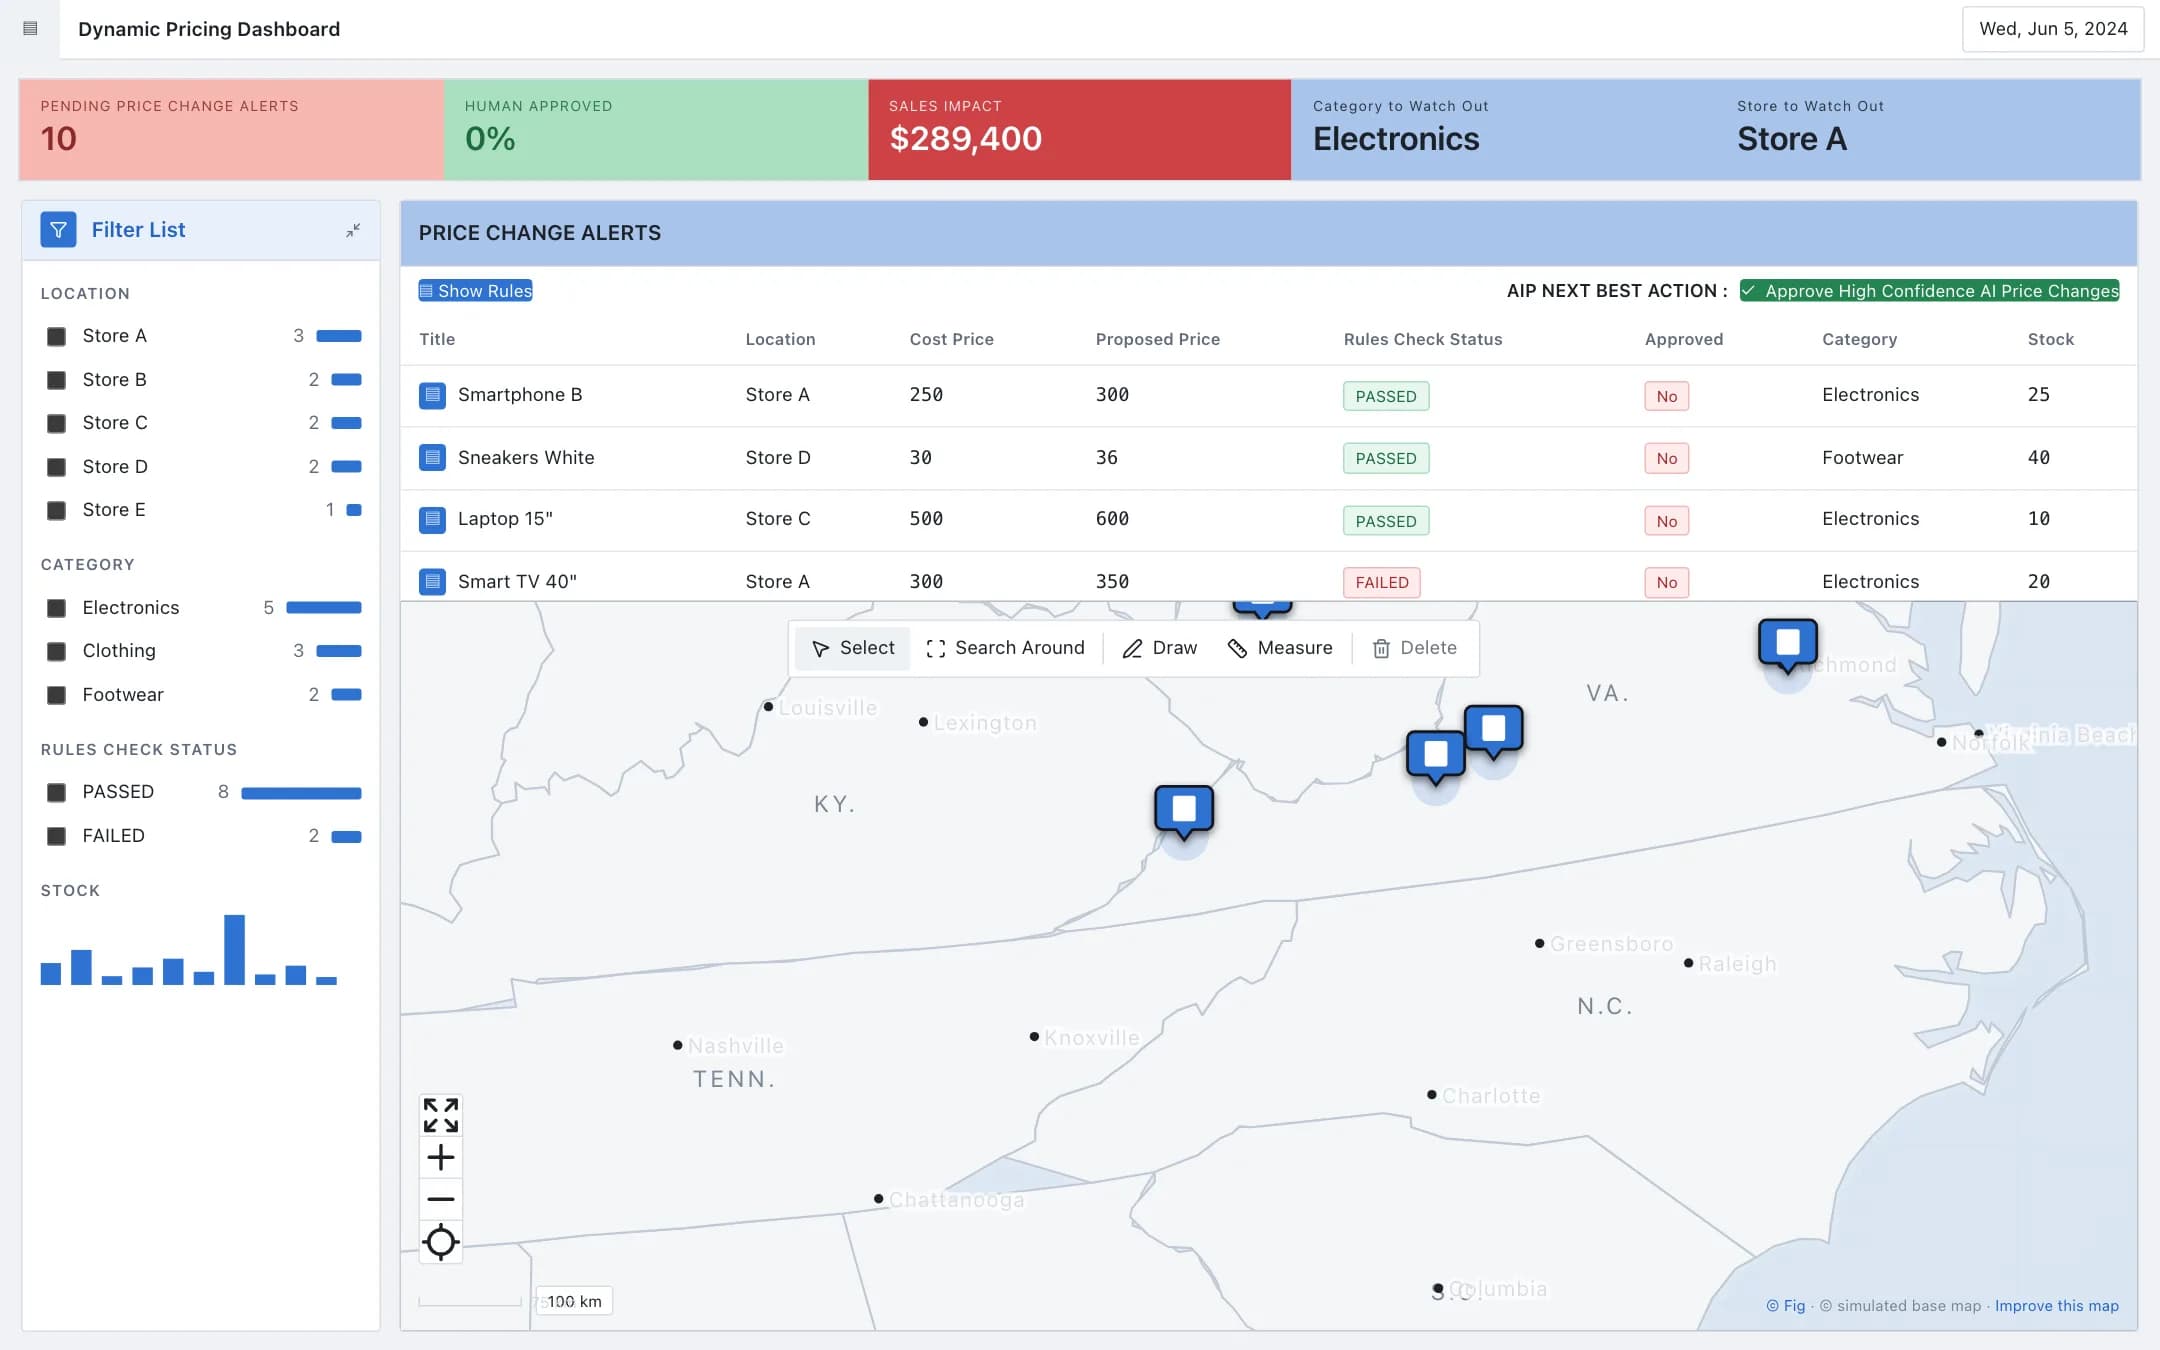
Dynamic pricing for retail
Dynamic pricing for retail: price change alerts with their rules-check status and approval, the business rules a proposed price is checked against with competitor, margin, stable-price and regulation figures, approve or set a new price, scheduled updates within budget, and AI scenarios that explore the effect of a price on competitors, existing customers and margin.