Yield optimization and batch analysis
Yield and cost at the granularity of a batch: output by plant or line against target, the downtime events behind a dip, and a scenario panel that models a setpoint change and orchestrates it to the line inside HACCP limits.
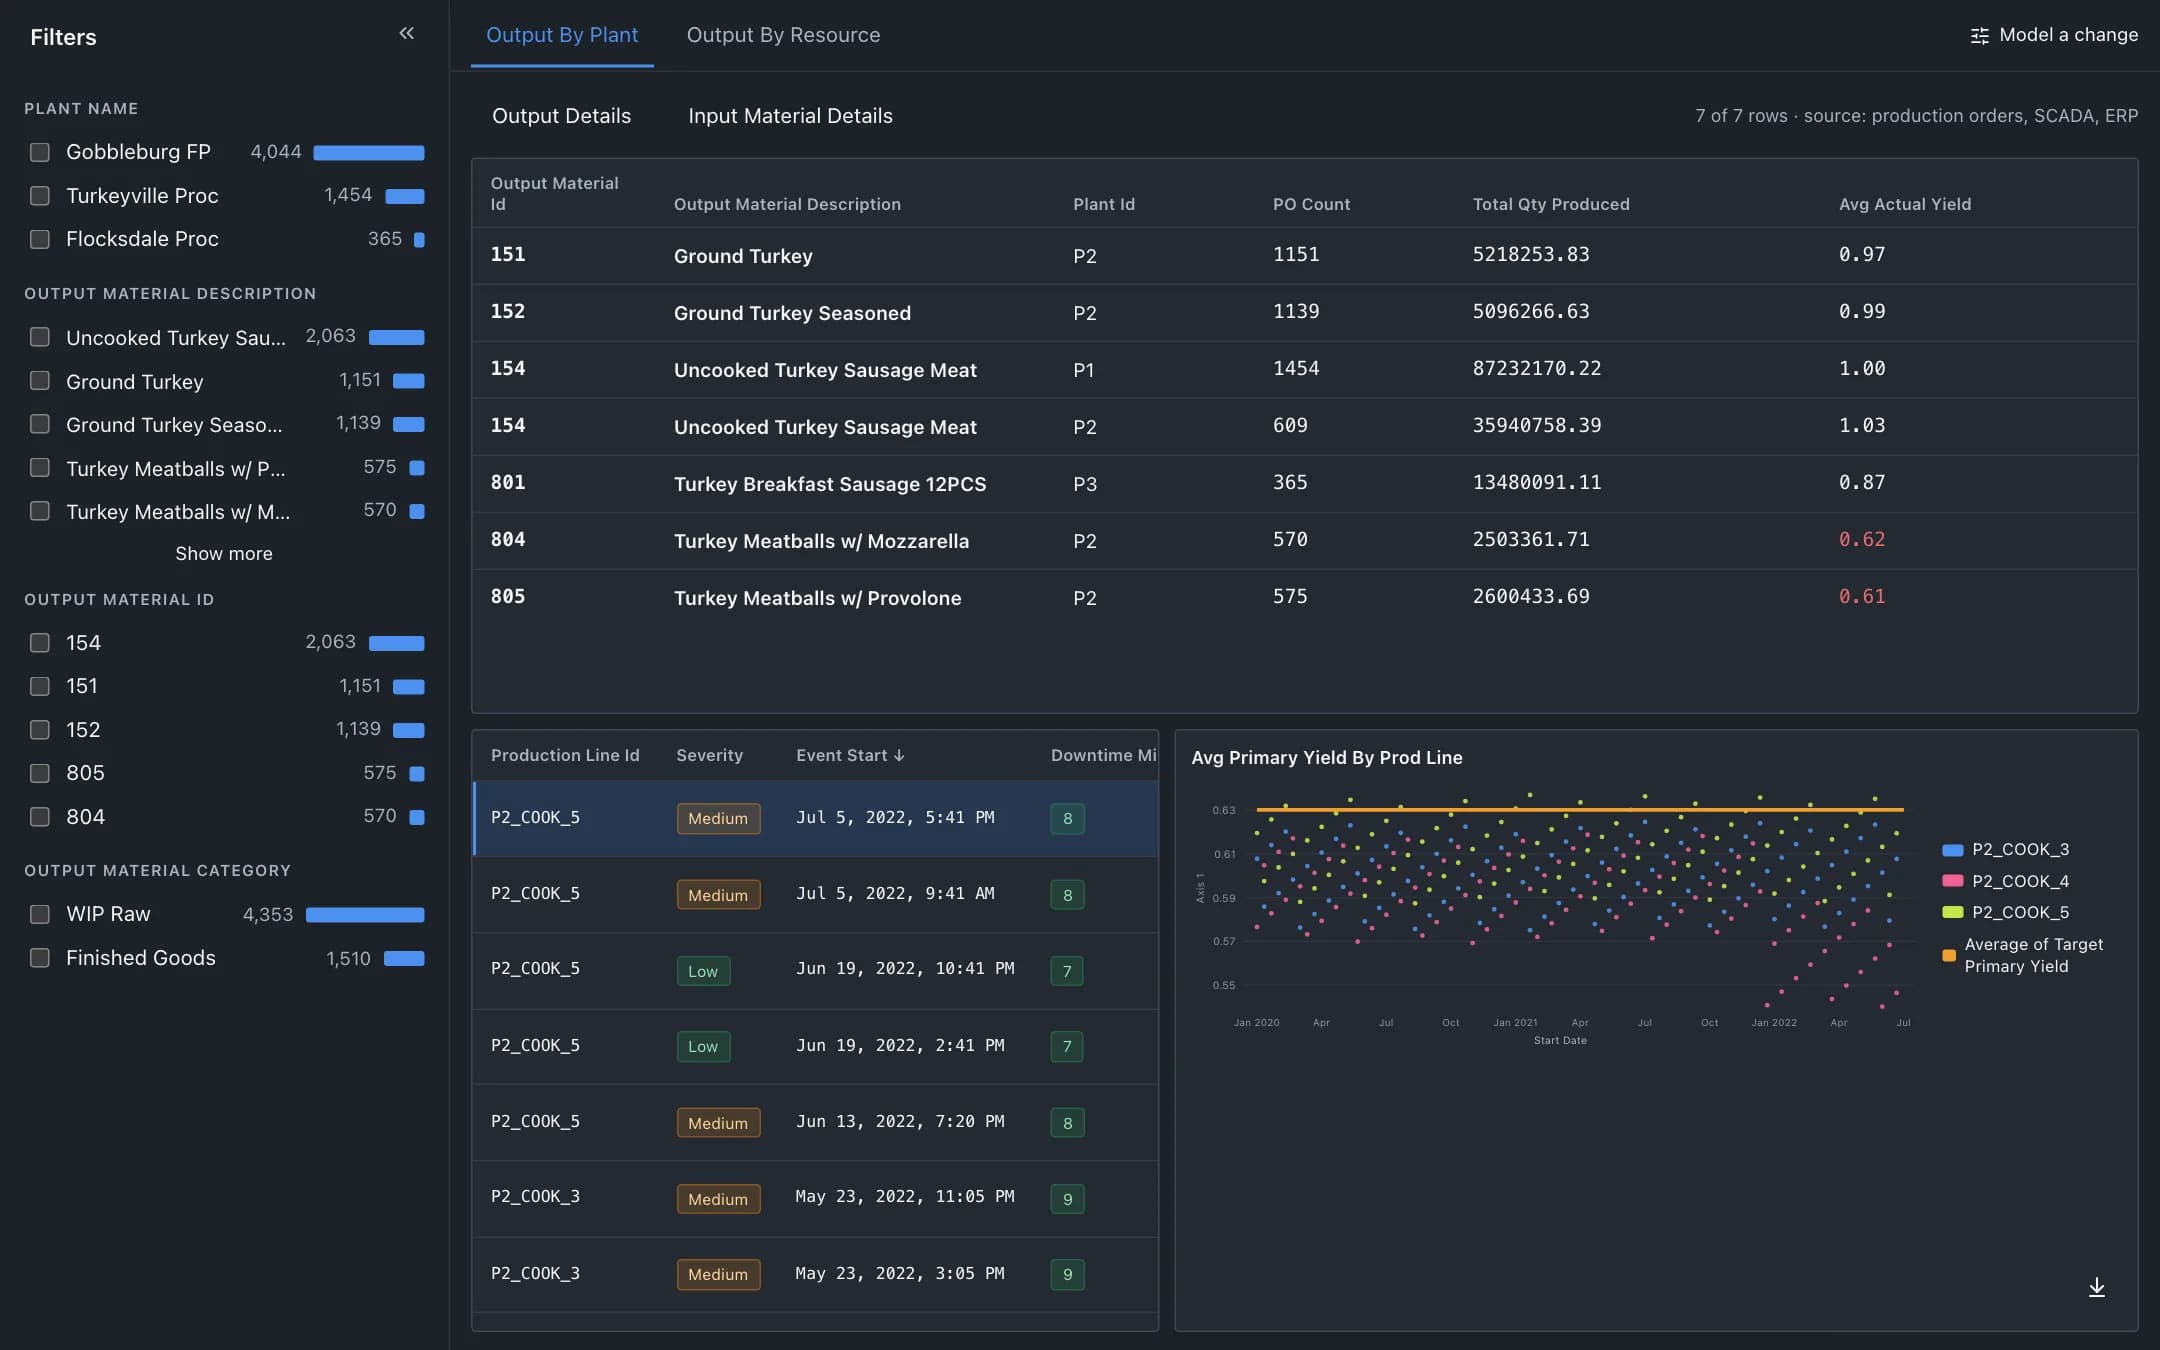
A sample of the app on simulated data. Book a call to click through it live, or to see it on your own exports.
One working session with the people in the seat: which decisions, which systems, what a good week looks like.
The app you see above, running on your own exports instead of the simulated world. Every screen, every decision, your numbers.
Wired to your systems with your permissions, agents proposing, people approving, the ledger recording who did what.
Overview
Yield is reported monthly by plant, after the fact. The drivers, raw material inputs, temperature setpoints, downtime and labor, live in the ERP, the SCADA historian and maintenance, and never meet the batch they affected.
The app hydrates the ontology with production orders, processes, lines, raw material orders, finance and maintenance tables and SCADA series, so every batch carries its inputs, its yield and its cost. Filter by plant and material, compare lines against the target, read the downtime events under a dip, then model a change and send it to the production and maintenance systems.
Key features
- Supply chain yield control tower: production yield and cost of goods at material and plant level, BOM target against actual.
- Batch analysis: output by plant or resource with PO count, quantity produced and average actual yield.
- Yield optimization interface: scenario modeling of raw-material and setpoint changes, with the efficiency change measured.
- Orchestration: approved changes written to production lifecycle and maintenance control systems, within HACCP limits.
Decisions it produces
- Change a setpoint or input and orchestrate it to the line
- Prioritise a line or material for a corrective measure
- Investigate a downtime event against the batches it affected
- Export the batch table for finance
Data sources
| Production orders and processes | batches, lines, locations, quantities |
|---|---|
| Raw material orders | inputs and their ratios per batch |
| SCADA | temperature setpoints, run times, downtime events |
| Finance and maintenance ERP tables | cost per batch, labor, maintenance events |
Simulated data throughout. Book a call to see it on your own systems.
Related demos
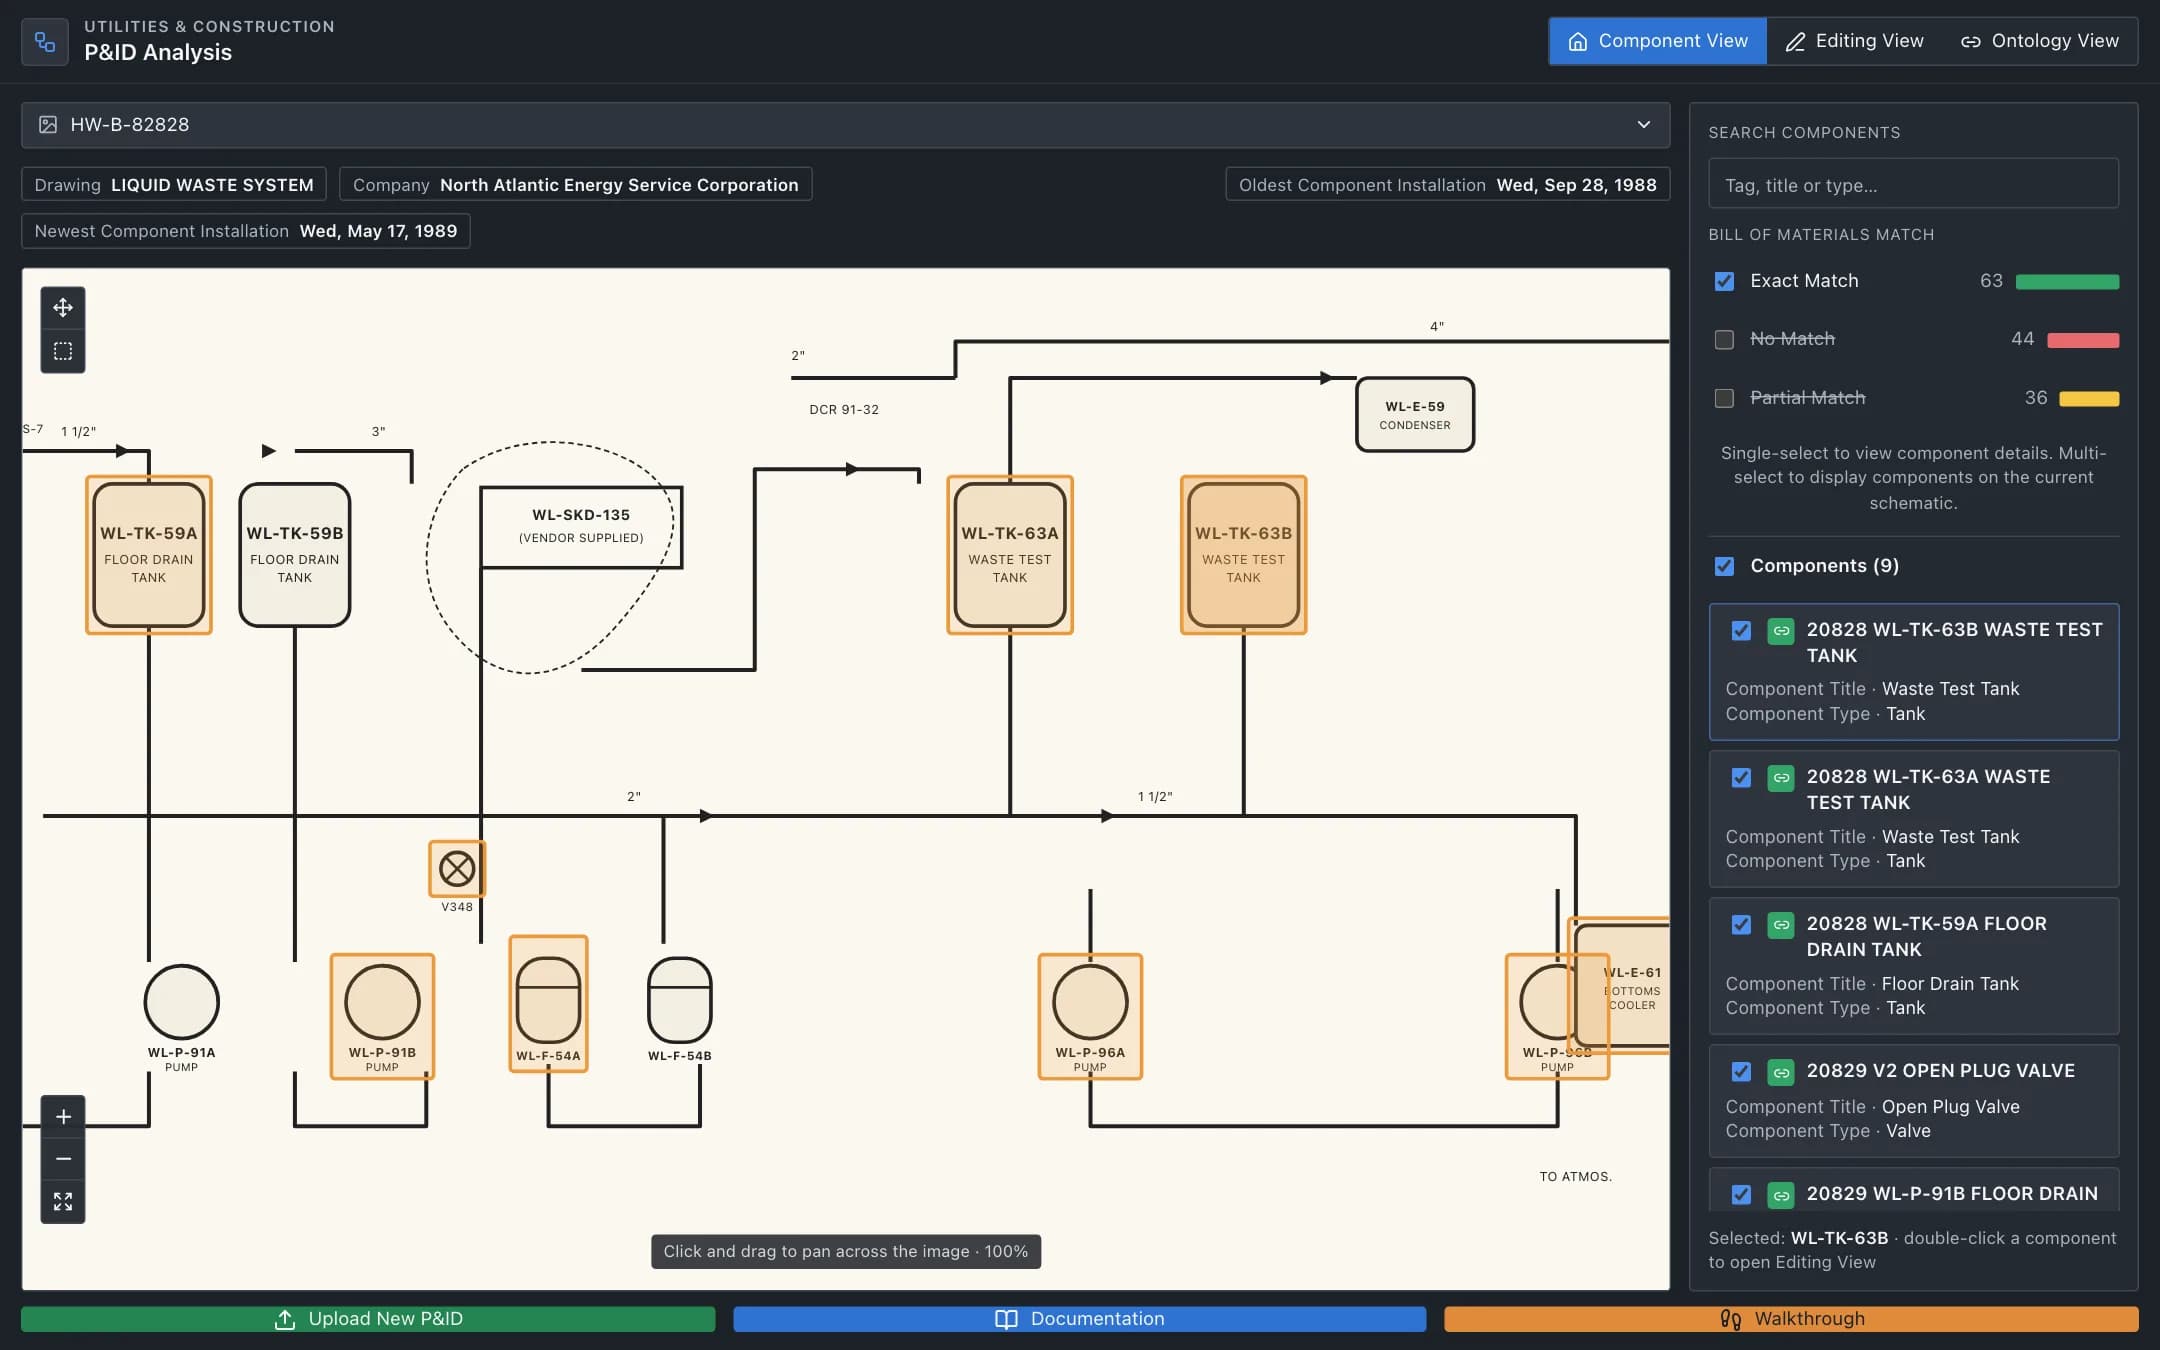 Production ready in 15 days
P&ID analysis
Components and their tags extracted from scanned P&ID drawings by a vision model, matched to the bill of materials, validated and relabeled by a maintenance engineer, and published as an ontology of the plant.
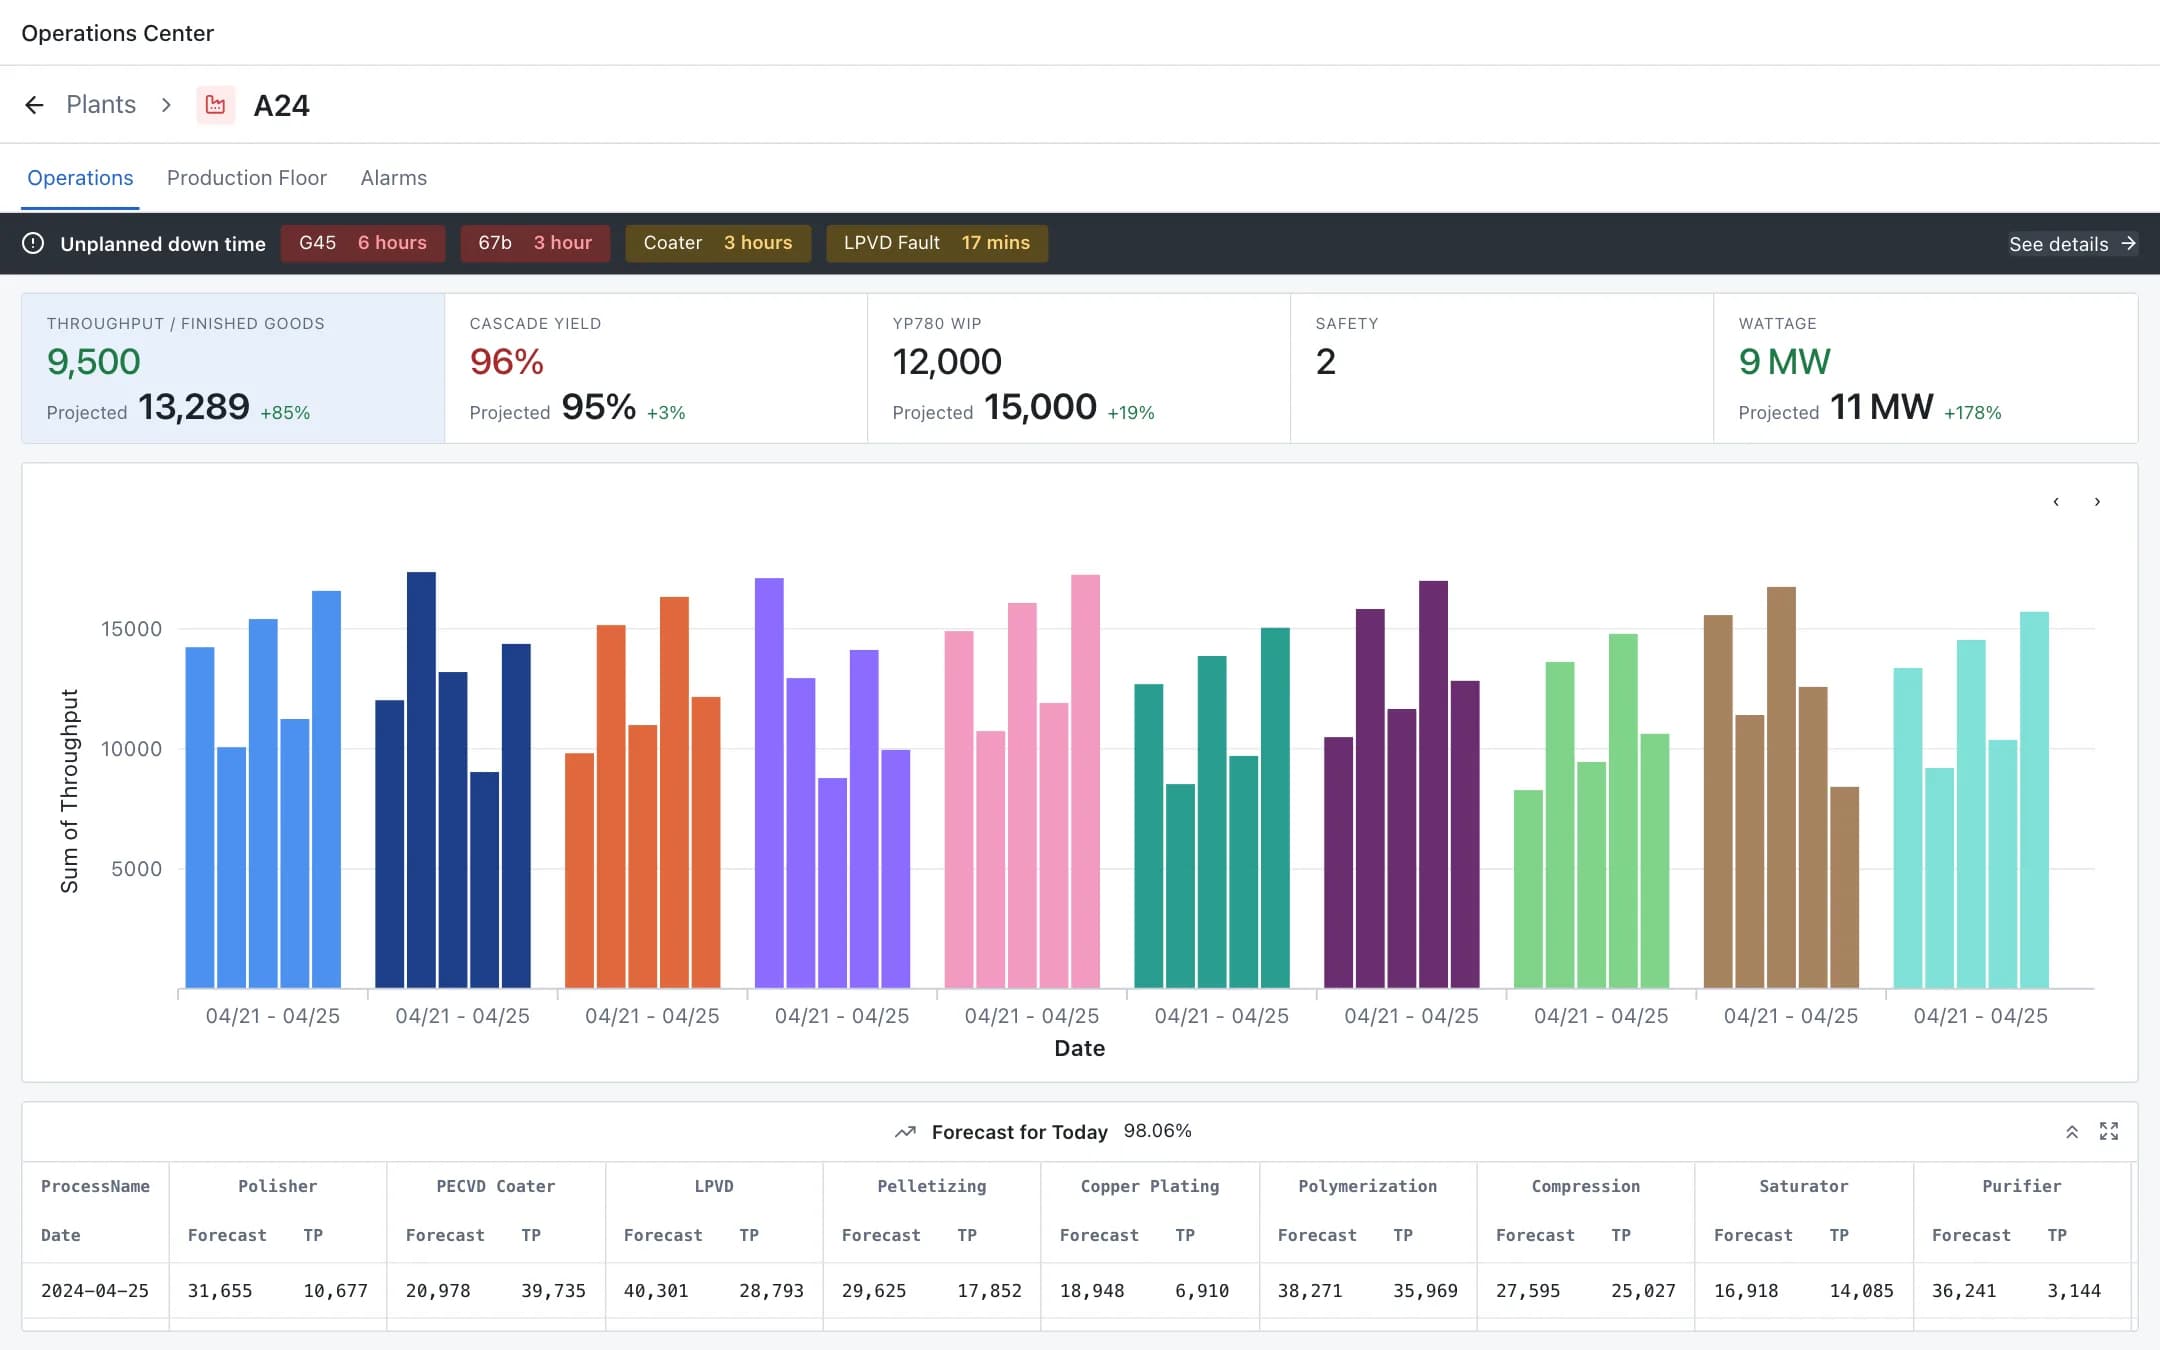 Production ready in 20 days
Plant digital twin
A live digital twin of the plant: operations KPIs and throughput by process, the production floor from building to zone to a single pump with its sensors, images and manual, and incident management with approve, reject and take action.
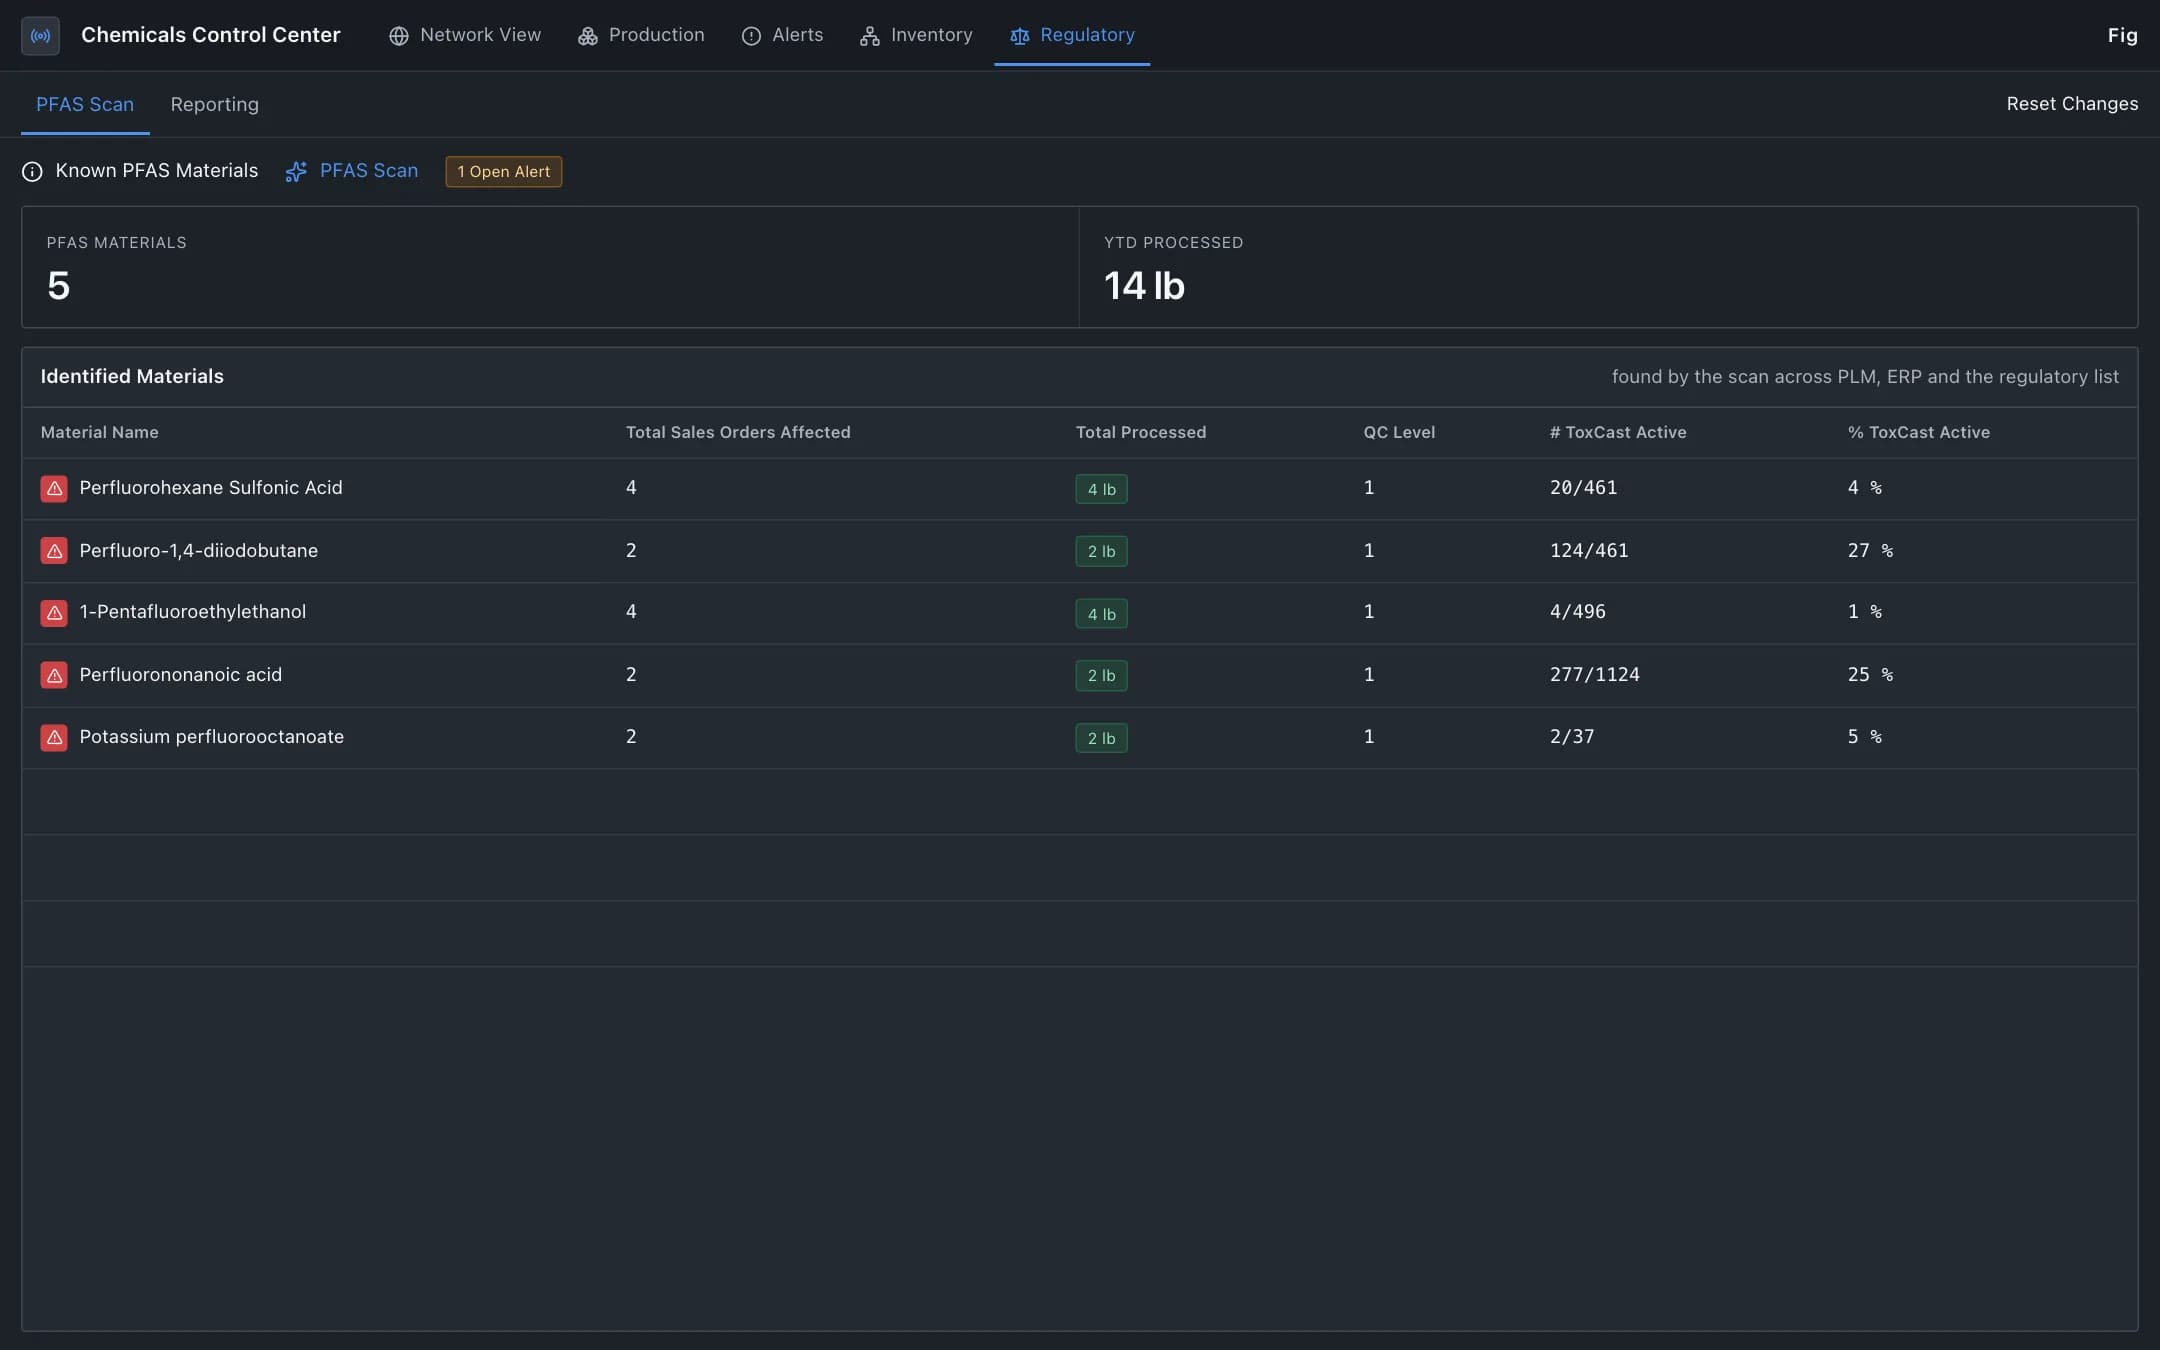 Production ready in 15 days
Hazardous material compliance
Regulated materials such as PFAS traced from raw material through the bill of materials, production and sales orders, with each reporting decision validated against the published regulation and compliance status by jurisdiction.