Process optimization
A control room where an optimiser proposes re-sequenced repair steps per product and fault under configurable guardrails, a manager reads the AI explanation and approves or rejects each proposal into an audit log, and process mining shows where the cases, time and bottlenecks are.
One working session with the people in the seat: which decisions, which systems, what a good week looks like.
The app you see above, running on your own exports instead of the simulated world. Every screen, every decision, your numbers.
Wired to your systems with your permissions, agents proposing, people approving, the ledger recording who did what.
Overview
Improving a repair process means testing scenarios over logs that change every day, with business rules that never made it into software. The downstream impact is large, so nobody changes the step order without a justification they can defend.
The app mines the logs into a process map with case counts, durations and bottleneck predictions, and an optimiser proposes new step orders per product model and fault for a time or a cost objective. Each proposal shows the proposed ranks with success rates and an LLM explanation on demand; approving one makes it the active ranking and rejects the competing proposals, and every decision and control change lands in the audit log. Controls and objectives are edited in the sidebar.
Key features
- Proposals: open, approved and rejected re-sequencing proposals per process sequence, model, fault and objective.
- Proposal details: proposed rank, success rate, solution id and the ranks for cost and time, with an AI explanation.
- Optimization controls and objectives: automation flag, sample-size threshold and active objectives, editable with an audit trail.
- Process mining: the step graph with case counts, median durations and bottleneck prediction, and corrective-action proposals.
Decisions it produces
- Approve or reject a re-sequencing proposal
- Change the automation controls or sample-size threshold
- Add or remove an optimisation objective
- Propose a corrective action for a bottleneck
Data sources
| Repair logs | steps, outcomes, durations per case |
|---|---|
| Work orders | product model, fault, solution ids |
| Cost data | step cost and standard time |
| Controls | optimisation controls, objectives, audit log |
Simulated data throughout. Book a call to see it on your own systems.
Related demos
Dynamic scheduling
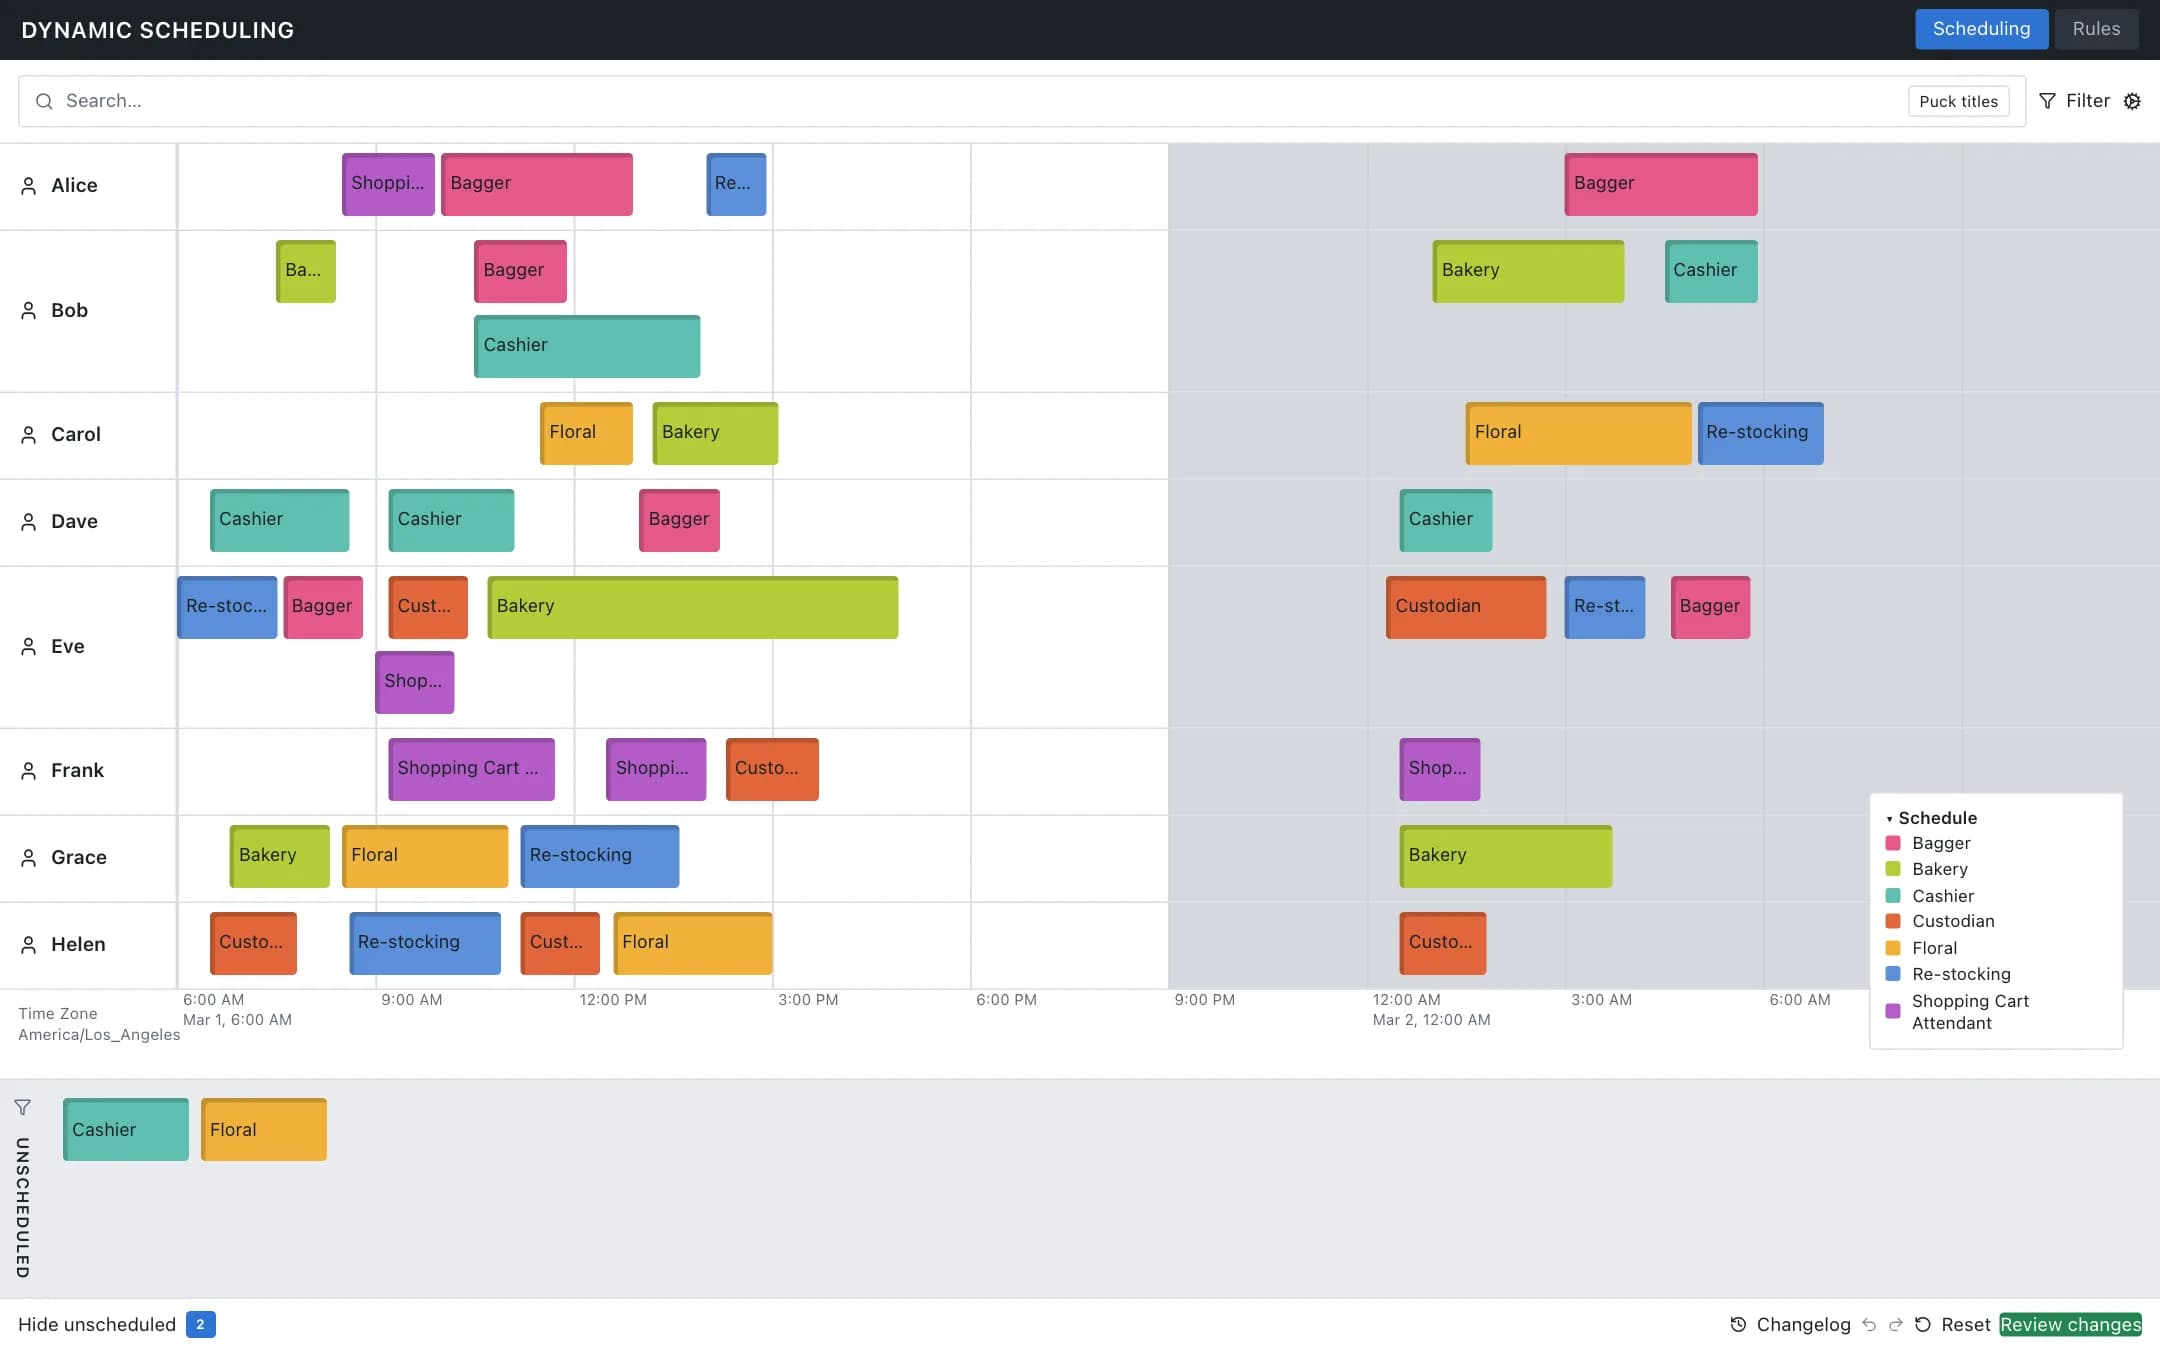
A shift board of employees and task pucks over the day with an unscheduled tray, undo, redo, reset and a review step, and a rules tab where deadline, duration, gap, overlap and sequence constraints are enabled, disabled, debugged or written in plain language and translated into constraints the board enforces.
Yield optimization and batch analysis
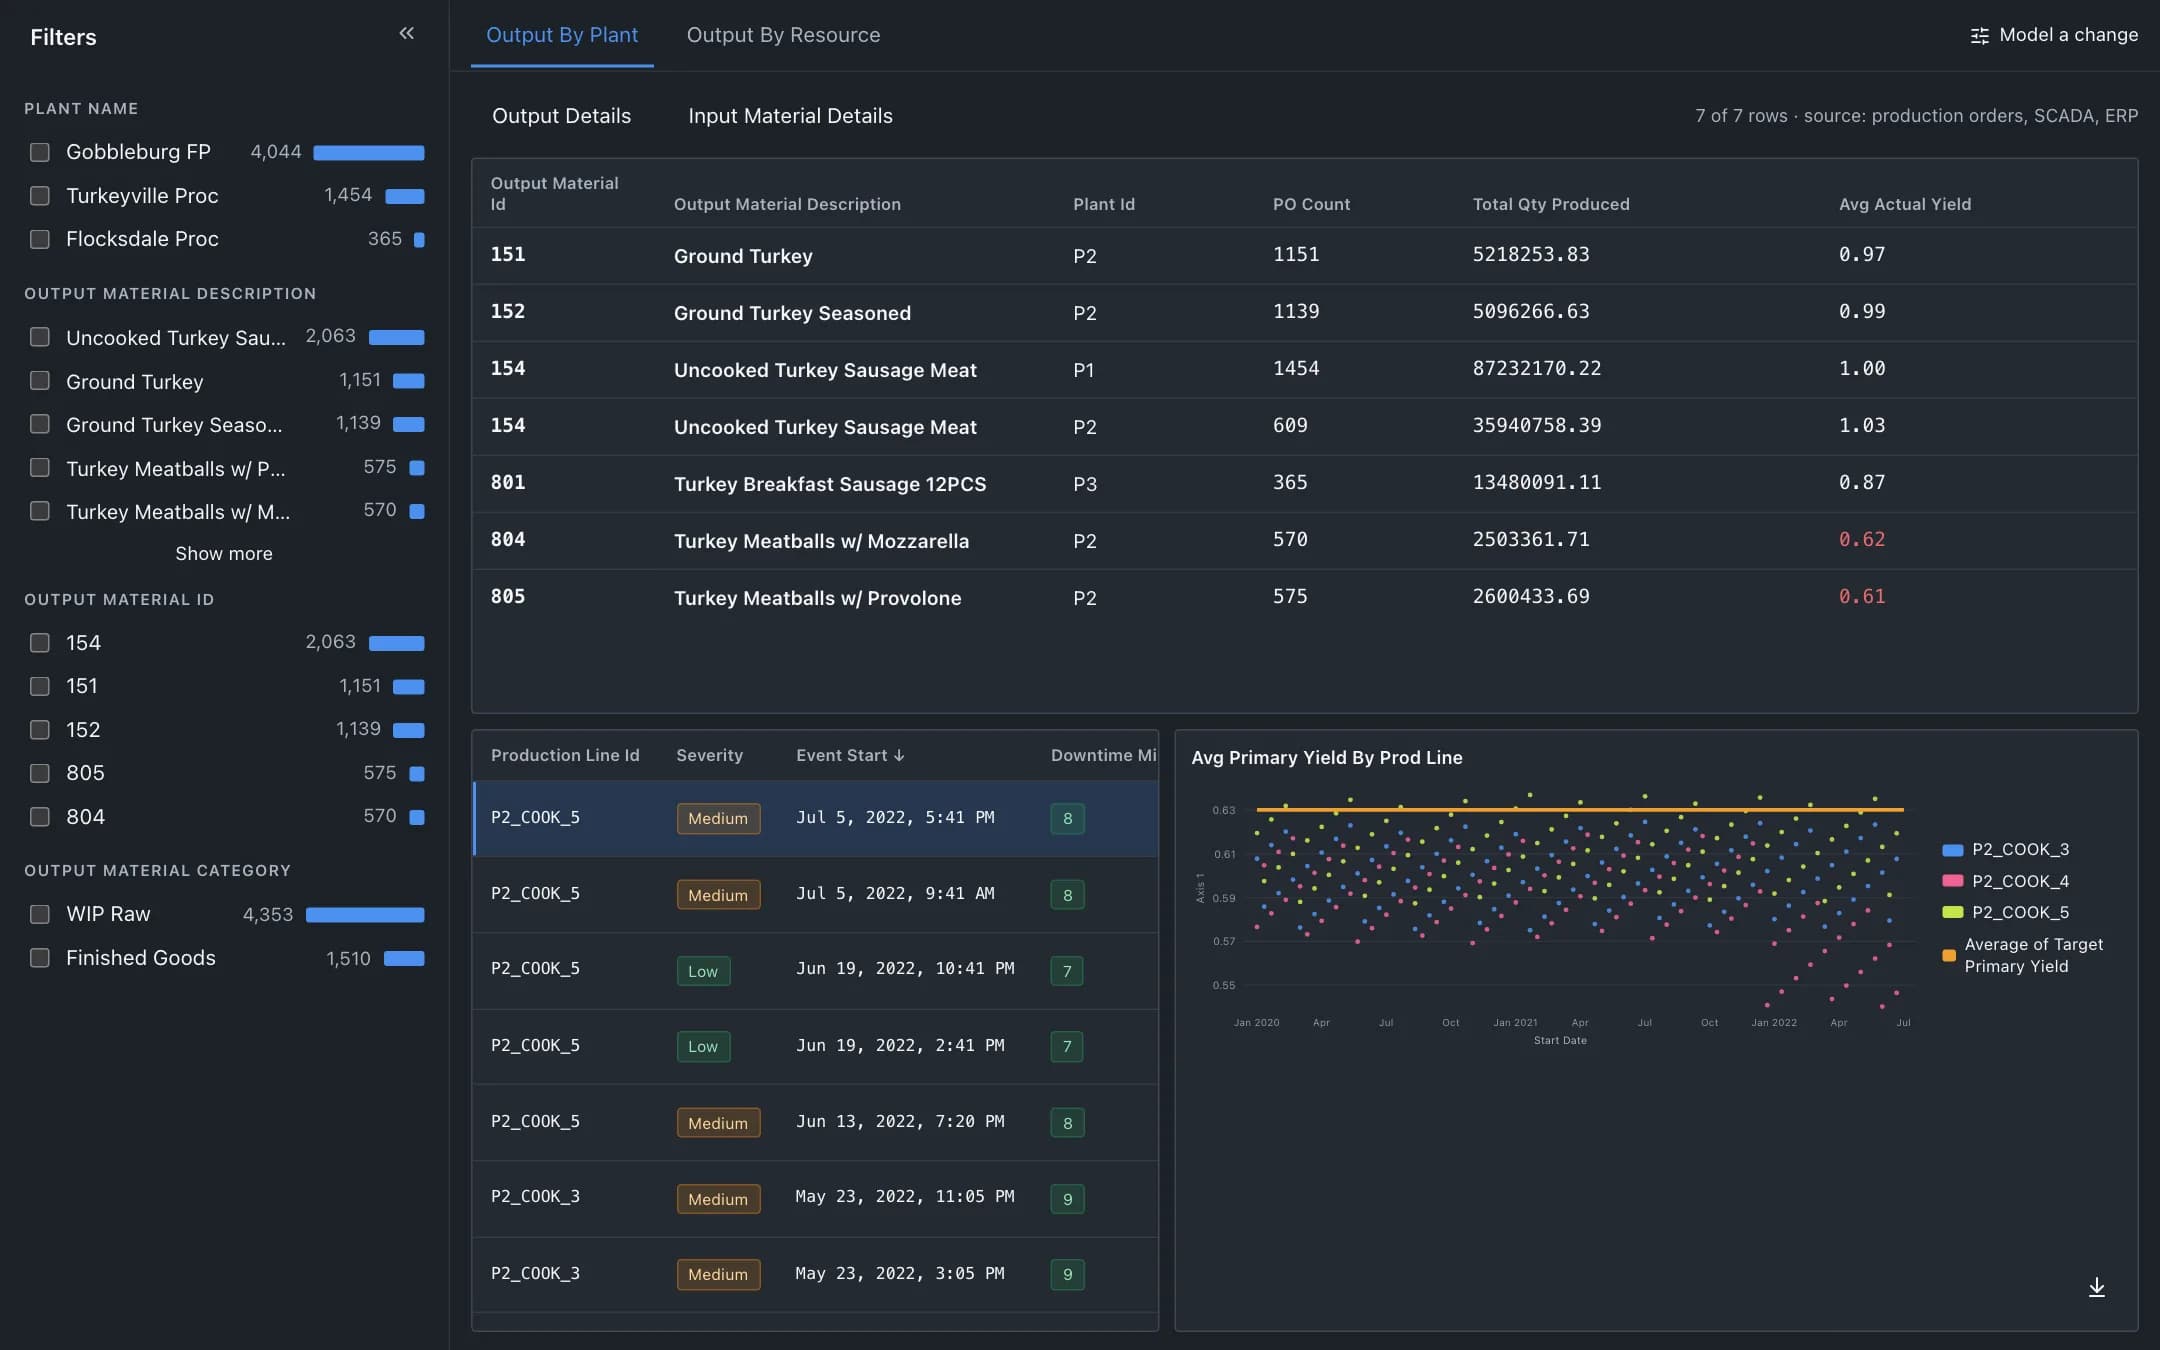
Yield and cost at the granularity of a batch: output by plant or line against target, the downtime events behind a dip, and a scenario panel that models a setpoint change and orchestrates it to the line inside HACCP limits.
Accounts payable automation
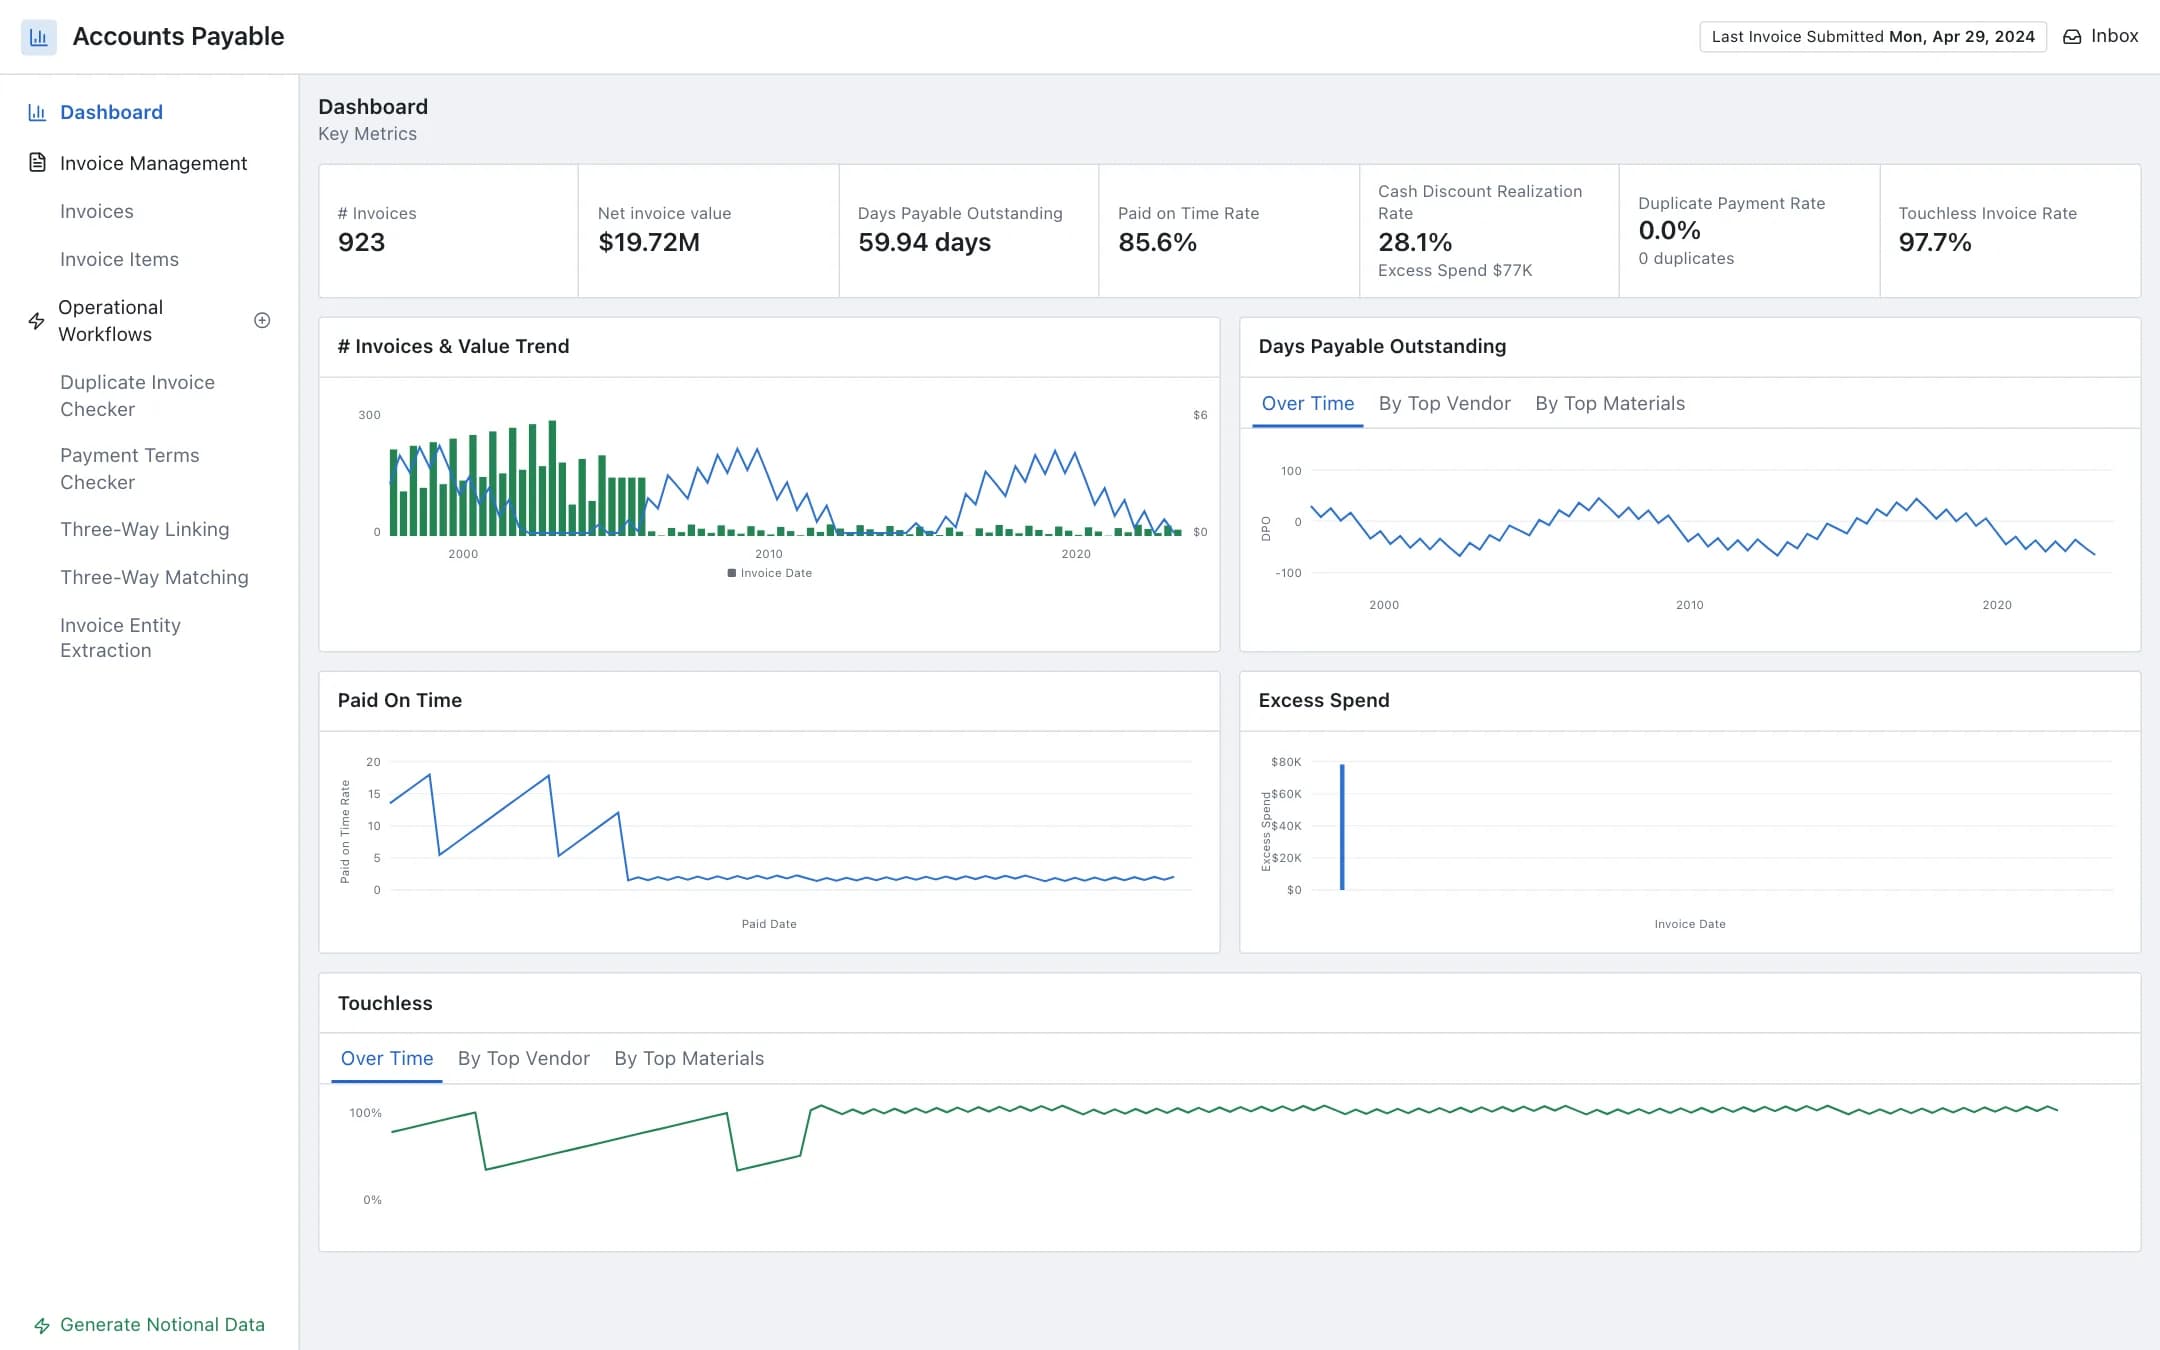
An accounts payable workspace with a metrics dashboard, invoice items mined as a process with bottleneck prediction, and operational workflows for duplicate invoices, payment terms, three-way linking and matching and invoice entity extraction, each ending in an action back to the ERP.